UNITED STATES
SECURITIES AND EXCHANGE COMMISSION
WASHINGTON, D.C. 20549
FORM 10-K
(Mark One)
| ☒ | ANNUAL REPORT PURSUANT TO SECTION 13 OR 15(d) OF THE SECURITIES EXCHANGE ACT OF 1934 |
For the fiscal year ended March 31, 2017
OR
| ☐ | TRANSITION REPORT PURSUANT TO SECTION 13 OR 15(d) OF THE SECURITIES EXCHANGE ACT OF 1934 |
For the transition period from to
Commission file number 814-00704
GLADSTONE INVESTMENT CORPORATION
(Exact name of registrant as specified in its charter)
| Delaware | 83-0423116 | |
| (State or other jurisdiction of incorporation or organization) |
(I.R.S. Employer Identification No.) | |
| 1521 Westbranch Drive, Suite 100 McLean, Virginia |
22102 | |
| (Address of principal executive offices) | (Zip Code) | |
(703) 287-5800
(Registrant’s telephone number, including area code)
Securities registered pursuant to Section 12(b) of the Act:
| (Title of Each Class) |
(Name of Each Exchange on Which Registered) | |
| Common Stock, $0.001 par value per share | NASDAQ Global Select Market | |
| 6.75% Series B Cumulative Term Preferred Stock, $0.001 par value per share | NASDAQ Global Select Market | |
| 6.50% Series C Cumulative Term Preferred Stock, $0.001 par value per share | NASDAQ Global Select Market | |
| 6.25% Series D Cumulative Term Preferred Stock, $0.001 par value per share | NASDAQ Global Select Market |
Securities registered pursuant to Section 12(g) of the Act: None
Indicate by check mark if the registrant is a well-known seasoned issuer, as defined in Rule 405 of the Securities Act. YES ☐ NO ☒
Indicate by check mark if the registrant is not required to file reports pursuant to Section 13 or Section 15(d) of the Act. YES ☐ NO ☒
Indicate by check mark whether the registrant (1) has filed all reports required to be filed by Section 13 or 15(d) of the Securities Exchange Act of 1934 during the preceding 12 months (or for such shorter period that the registrant was required to file such reports), and (2) has been subject to such filing requirements for the past 90 days. YES ☒ NO ☐
Indicate by check mark whether the registrant has submitted electronically and posted on its corporate Web site, if any, every Interactive Data File required to be submitted and posted pursuant to Rule 405 of Regulation S-T during the preceding 12 months (or for such shorter period that the registrant was required to submit and post such files). YES ☐ NO ☐
Indicate by check mark if disclosure of delinquent filers pursuant to Item 405 of Regulation S-K is not contained herein, and will not be contained, to the best of registrant’s knowledge, in definitive proxy or information statements incorporated by reference in Part III of this Form 10-K or any amendment to this Form 10-K. ☒
Indicate by check mark whether the registrant is a large accelerated filer, an accelerated filer, a non-accelerated filer, a smaller reporting company, or an emerging growth company. See the definitions of “large accelerated filer,” “accelerated filer,” “smaller reporting company,” and “emerging growth company” in Rule 12b-2 of the Exchange Act.
| Large accelerated filer | ☐ | Accelerated filer | ☒ | |||
| Non-accelerated filer | ☐ (Do not check if a smaller reporting company) | Smaller reporting company | ☐ | |||
| Emerging growth company | ☐ | |||||
If an emerging growth company, indicate by check mark if the registrant has elected not to use the extended transition period for complying with any new or revised financial accounting standards provided pursuant to Section 13(a) of the Exchange Act. ☐
Indicate by check mark whether the registrant is a shell company (as defined in Rule 12b-2 of the Act). YES ☐ NO ☒
The aggregate market value of the voting stock held by non-affiliates of the Registrant on September 30, 2016, based on the closing price on that date of $8.89 on the NASDAQ Global Select Market, was $260,762,147. For the purposes of calculating this amount only, all directors and executive officers of the Registrant have been treated as affiliates. There were 32,370,958 shares of the Registrant’s Common Stock, $0.001 par value, outstanding as of May 12, 2017.
Documents Incorporated by Reference. Portions of the Registrant’s definitive proxy statement relating to the Registrant’s 2017 Annual Meeting of Stockholders to be filed with the Securities and Exchange Commission pursuant to Regulation 14A are incorporated by reference into Part III of this Annual Report on Form 10-K as indicated herein. Such proxy statement will be filed with the Securities and Exchange Commission no later than 120 days following the end of the Registrant’s fiscal year ended March 31, 2017.
GLADSTONE INVESTMENT CORPORATION
FORM 10-K FOR THE FISCAL YEAR ENDED
MARCH 31, 2017
1
FORWARD-LOOKING STATEMENTS
All statements contained herein, other than historical facts, may constitute “forward-looking statements.” These statements may relate to, among other things, our future operating results, our business prospects and the prospects of our portfolio companies, actual and potential conflicts of interest with Gladstone Management Corporation and its affiliates, the use of borrowed money to finance our investments, the adequacy of our financing sources and working capital, and our ability to co-invest, among other factors. In some cases, you can identify forward-looking statements by terminology such as “estimate,” “may,” “might,” “believe,” “will,” “provided,” “anticipate,” “future,” “could,” “growth,” “plan,” “project,” “intend,” “expect,” “should,” “would,” “if,” “seek,” “possible,” “potential,” “likely” or the negative or variations of such terms or comparable terminology. These forward-looking statements involve known and unknown risks, uncertainties and other factors that may cause our actual results, levels of activity, performance, or achievements to be materially different from any future results, levels of activity, performance, or achievements expressed or implied by such forward-looking statements. Such factors include, but are not limited to: (1) the recurrence of adverse events in the economy and the capital markets; (2) risks associated with negotiation and consummation of pending and future transactions; (3) the loss of one or more of our executive officers, in particular David Gladstone, Terry Lee Brubaker, or David Dullum; 4) changes in our investment objectives and strategy; (5) availability, terms (including the possibility of interest rate volatility) and deployment of capital; (6) changes in our industry, interest rates, exchange rates, regulation, or the general economy; (7) the degree and nature of our competition; (8) our ability to maintain our qualification as a regulated investment company and as a business development company; and (9) those factors described in Item 1A. “Risk Factors” of this Annual Report on Form 10-K. We caution readers not to place undue reliance on any such forward-looking statements. Actual results could differ materially from those anticipated in our forward-looking statements and future results could differ materially from historical performance. We have based forward-looking statements on information available to us on the date of this Annual Report on Form 10-K. Except as required by the federal securities laws, we undertake no obligation to publicly update or revise any forward-looking statements, whether as a result of new information, future events or otherwise, after the date of this Annual Report on Form 10-K. Although we undertake no obligation to revise or update any forward-looking statements, whether as a result of new information, future events, or otherwise, you are advised to consult any additional disclosures that we may make directly to you or through reports that we have filed, or in the future may file, with the U.S. Securities and Exchange Commission, including subsequent annual reports on Form 10-K, quarterly reports on Form 10-Q and current reports on Form 8-K.
In this Annual Report on Form 10-K (the “Annual Report”), the “Company,” “we,” “us,” and “our” refer to Gladstone Investment Corporation and its wholly-owned subsidiaries unless the context otherwise indicates. Dollar amounts, except per share amounts, are in thousands unless otherwise indicated.
PART I
The information contained in this section should be read in conjunction with our accompanying Consolidated Financial Statements and the notes thereto appearing elsewhere in this Annual Report.
Overview
Organization
We were incorporated under the General Corporation Law of the State of Delaware on February 18, 2005. On June 22, 2005, we completed our initial public offering and commenced operations. We operate as an externally managed, closed-end, non-diversified management investment company and have elected to be treated as a business development company (“BDC”) under the Investment Company Act of 1940, as amended (the “1940 Act”). For federal income tax purposes, we have elected to be treated as a regulated investment company (“RIC”) under Subchapter M of the Internal Revenue Code of 1986, as amended (the “Code”). To continue to qualify as a RIC for federal income tax purposes and obtain favorable RIC tax treatment, we must meet certain requirements, including certain minimum distribution requirements. Since our initial public offering in 2005 and through March 31, 2017, we have made 141 consecutive monthly distributions to common stockholders.
Our shares of common stock, 6.75% Series B Cumulative Term Preferred Stock (“Series B Term Preferred Stock”), 6.50% Series C Cumulative Term Preferred Stock (“Series C Term Preferred Stock”) and 6.25% Series D Cumulative Term Preferred Stock (“Series D Term Preferred Stock”) are traded on the NASDAQ Global Select Market (“NASDAQ”) under the trading symbols “GAIN,” “GAINO,” “GAINN,” and “GAINM,” respectively.
2
Investment Adviser and Administrator
We are externally managed by Gladstone Management Corporation (the “Adviser”), an affiliate of ours, under an investment advisory and management agreement (the “Advisory Agreement”) and another of our affiliates, Gladstone Administration, LLC, (the “Administrator”) provides administrative services to us pursuant to a contractual agreement (the “Administration Agreement”). Each of the Adviser and Administrator are privately-held companies that are indirectly owned and controlled by David Gladstone, our chairman and chief executive officer. Mr. Gladstone and Terry Brubaker, our vice chairman and chief operating officer, also serve on the board of directors of the Adviser, the board of managers of the Administrator, and serve as executive officers of the Adviser and the Administrator. The Administrator employs, among others, our chief financial officer and treasurer, chief valuation officer, chief compliance officer, general counsel and secretary (who also serves as the president of the Administrator) and their respective staffs. The Adviser and Administrator have extensive experience in our lines of business and also provide investment advisory and administrative services, respectively, to our affiliates, including, but not limited to: Gladstone Commercial Corporation (“Gladstone Commercial”), a publicly-traded real estate investment trust; Gladstone Capital Corporation (“Gladstone Capital”), a publicly-traded BDC and RIC; and Gladstone Land Corporation, a publicly-traded real estate investment trust (“Gladstone Land,” together with “Gladstone Commercial,” and “Gladstone Capital,” collectively the “Affiliated Public Funds”). In the future, the Adviser and Administrator may provide investment advisory and administrative services, respectively, to other funds and companies, both public and private.
The Adviser is organized as a corporation under the laws of the State of Delaware on July 2, 2002, and is a registered investment adviser under the Investment Advisers Act of 1940, as amended. The Administrator was organized as a limited liability company under the laws of the State of Delaware on March 18, 2005. The Adviser and Administrator are headquartered in McLean, Virginia, a suburb of Washington, D.C. The Adviser also has offices in several other states.
Investment Objectives and Strategy
We were established for the purpose of investing in debt and equity securities of established private businesses operating in the United States (“U.S.”). Our investment objectives are to: (i) achieve and grow current income by investing in debt securities of established businesses that we believe will provide stable earnings and cash flow to pay expenses, make principal and interest payments on our outstanding indebtedness and make distributions to stockholders that grow over time; and (ii) provide our stockholders with long-term capital appreciation in the value of our assets by investing in equity securities, generally in combination with the aforementioned debt securities, of established businesses that we believe can grow over time to permit us to sell our equity investments for capital gains. To achieve our objectives, our investment strategy is to invest in several categories of debt and equity securities, with individual investments generally totaling up to $30 million, although investment size may vary, depending upon our total assets or available capital at the time of investment. We intend that our investment portfolio over time will consist of approximately 75% in debt securities and 25% in equity securities, at cost. As of March 31, 2017, our investment portfolio was made up of 72.0% in debt securities and 28.0% in equity securities, at cost.
We focus on investing in lower middle market private businesses (which we generally define as private companies with annual earnings before interest, taxes, depreciation and amortization (“EBITDA”) of $3 million to $20 million) (“Lower Middle Market”) in the U.S. that meet certain criteria, including, but not limited to, the following: the sustainability of the business’ free cash flow and its ability to grow it over time, adequate assets for loan collateral, experienced management teams with a significant ownership interest in the portfolio company, reasonable capitalization of the portfolio company, including an ample equity contribution or cushion based on prevailing enterprise valuation multiples, and the potential to realize appreciation and gain liquidity in our equity position, if any. We anticipate that liquidity in our equity position will be achieved through a merger or acquisition of the portfolio company, a public offering of the portfolio company’s stock or, to a lesser extent, by exercising our right to require the portfolio company to repurchase our warrants, as applicable, though there can be no assurance that we will always have these rights. We invest in portfolio companies that need funds for growth capital or to finance acquisitions or recapitalize or, to a lesser extent, refinance their existing debt facilities. We seek to avoid investing in high-risk, early-stage enterprises.
We invest by ourselves or jointly with other funds and/or management of the portfolio company, depending on the opportunity. In July 2012, the U.S. Securities and Exchange Commission (“SEC”) granted us an exemptive order (the “Co-Investment Order”) that expanded our ability to co-invest with certain of our affiliates, including Gladstone Capital, under certain circumstances and any future business development company or closed-end management investment company that is advised (or sub-advised if it controls the fund) by our external investment adviser, or any combination of the foregoing, subject to the conditions in the SEC’s order. Since 2012, we have opportunistically made several co-investments with our affiliate Gladstone Capital pursuant to the Co-Investment Order. We believe the Co-Investment Order has enhanced and will continue to enhance our ability to further our investment objectives and strategies. If we are participating in an investment with one or more co-investors, whether or not an affiliate of ours, our investment is likely to be smaller than if we were investing alone.
3
In general, our investments in debt securities have a term of five years, accrue interest at variable rates (based on the one-month London Interbank Offered Rate (“LIBOR”)) and, to a lesser extent, at fixed rates. As of March 31, 2017, our loan portfolio consisted of 92.9% variable rate loans with floors and 7.1% fixed rate loans based on the total principal balance of all outstanding debt investments. We seek debt instruments that pay interest monthly or, at a minimum, quarterly, and which may include a yield enhancement such as a success fee or, to a lesser extent, deferred interest provision and are primarily interest only, with all principal and any accrued but unpaid interest due at maturity. Generally, success fees accrue at a set rate and are contractually due upon a change of control of the business. Some debt securities may have deferred interest whereby some portion of the interest payment is added to the principal balance so that the interest is paid, together with the principal, at maturity. This form of deferred interest is often called “paid-in-kind” (“PIK”) interest. As of March 31, 2017, we did not have any securities with a PIK feature.
Typically, our investments in equity securities take the form of common stock, preferred stock, limited liability company interests, or warrants or options to purchase any of the foregoing. Often, these equity investments occur in connection with our original investment, buyouts and recapitalizations of a business, or refinancing existing debt. Since our initial public offering in 2005 and through March 31, 2017, we have made investments in 45 companies, excluding investments in syndicated loans.
We expect that our investment portfolio will continue to primarily include the following three categories of investments in private companies in the U.S.:
| • | First Lien Secured Debt Securities: We seek to invest a portion of our assets in first lien secured debt securities also known as senior loans, senior term loans, lines of credit and senior notes. Using its assets as collateral, the borrower typically uses first lien secured debt to cover a substantial portion of the funding needs of the business. These debt securities usually take the form of first priority liens on all, or substantially all, of the assets of the business. |
| • | Second Lien Secured Debt Securities: We seek to invest a portion of our assets in second lien secured debt securities, which may also be referred to as subordinated loans, subordinated notes and mezzanine loans. These second lien secured debt securities rank junior to the borrower’s first lien secured debt securities and may be secured by second priority liens on all or a portion of the assets of the business. Additionally, we may receive other yield enhancements, such as warrants to buy common and preferred stock or limited liability interests, in connection with these second lien secured debt securities. |
| • | Preferred and Common Equity/Equivalents: We seek to invest a portion of our assets in equity securities, which consist of preferred and common equity, limited liability company interests, warrants or options to acquire such securities, and are generally in combination with our debt investment in a business. Additionally, we may receive equity investments derived from restructurings on some of our existing debt investments. In many cases, we will own a significant portion of the equity of the businesses in which we invest. |
Pursuant to the 1940 Act, we must maintain at least 70% of our total assets in qualifying assets, which generally include each of the investment types listed above. Therefore, the 1940 Act permits us to invest up to 30% of our assets in other non-qualifying assets. See “— Regulation as a BDC — Qualifying Assets” for a discussion of the types of qualifying assets in which we are permitted to invest pursuant to Section 55(a) of the 1940 Act.
Because the majority of the loans in our portfolio consist of term debt in private companies that typically cannot or will not expend the resources to have their debt securities rated by a credit rating agency, we expect that most, if not all, of the debt securities we acquire will be unrated. Investors should assume that these loans would be rated below what is today considered “investment grade” quality. Investments rated below investment grade are often referred to as high yield securities or junk bonds and may be considered higher risk as compared to investment-grade debt instruments. With the exception of our policy to conduct our business as a BDC, these investment policies are not fundamental and may be changed without stockholder approval.
Investment Policies
We seek to achieve a high level of current income and capital gains through investments in secured debt securities and preferred and common stock that we generally acquire in connection with buyouts and other recapitalizations. The following investment policies, along with the investment objectives, may not be changed without the approval of our board of directors (our “Board of Directors”), a majority of whom are not “interested persons” as defined in Section 2(a)(19) of the 1940 Act:
| • | We will at all times conduct our business so as to retain our status as a BDC. In order to retain that status, we must be operated for the purpose of investing in certain categories of qualifying assets. In addition, we may not acquire any assets (other than non-investment assets necessary and appropriate to our operations as a BDC or qualifying assets) if, after giving effect to such acquisition, the value of our “qualifying assets” is less than 70% of the value of our total assets. We anticipate that the securities we seek to acquire will generally be qualifying assets. |
4
| • | We will at all times endeavor to conduct our business so as to retain our status as a RIC under the Code. To do so, we must meet income source, asset diversification and annual distribution requirements. We may issue senior securities, such as debt or preferred stock, to the extent permitted by the 1940 Act for the purpose of making investments, to fund share repurchases, or for temporary emergency or other purposes. |
Investment Concentrations
As of March 31, 2017, our investment portfolio consisted of investments in 35 portfolio companies located in 17 states across 18 different industries with an aggregate fair value of $501.6 million. Our investments in J.R. Hobbs Co. – Atlanta, LLC (“JR Hobbs”), Counsel Press, Inc. (“Counsel Press”), Cambridge Sound Management, Inc. (“Cambridge”), Nth Degree, Inc. (“Nth Degree”), and Drew Foam Companies, Inc. (“Drew Foam”) represented our five largest portfolio investments at fair value and collectively comprised $137.5 million, or 27.4%, of our total investment portfolio at fair value. The following table summarizes our investments by security type as of March 31, 2017 and 2016:
| March 31, 2017 | March 31, 2016 | |||||||||||||||||||||||||||||||
| Cost | Fair Value | Cost | Fair Value | |||||||||||||||||||||||||||||
| Secured first lien debt |
$ | 284,823 | 54.3 | % | $ | 268,150 | 53.5 | % | $ | 296,247 | 57.2 | % | $ | 280,037 | 57.4 | % | ||||||||||||||||
| Secured second lien debt |
93,078 | 17.7 | 95,040 | 18.9 | 72,978 | 14.1 | 64,484 | 13.2 | ||||||||||||||||||||||||
|
|
|
|
|
|
|
|
|
|
|
|
|
|
|
|
|
|||||||||||||||||
| Total debt |
377,901 | 72.0 | 363,190 | 72.4 | 369,225 | 71.3 | 344,521 | 70.6 | ||||||||||||||||||||||||
| Preferred equity |
140,791 | 26.8 | 113,515 | 22.6 | 141,702 | 27.3 | 113,550 | 23.3 | ||||||||||||||||||||||||
| Common equity/equivalents |
6,477 | 1.2 | 24,874 | 5.0 | 7,198 | 1.4 | 29,585 | 6.1 | ||||||||||||||||||||||||
|
|
|
|
|
|
|
|
|
|
|
|
|
|
|
|
|
|||||||||||||||||
| Total equity/equivalents |
147,268 | 28.0 | 138,389 | 27.6 | 148,900 | 28.7 | 143,135 | 29.4 | ||||||||||||||||||||||||
|
|
|
|
|
|
|
|
|
|
|
|
|
|
|
|
|
|||||||||||||||||
| Total investments |
$ | 525,169 | 100.0 | % | $ | 501,579 | 100.0 | % | $ | 518,125 | 100.0 | % | $ | 487,656 | 100.0 | % | ||||||||||||||||
|
|
|
|
|
|
|
|
|
|
|
|
|
|
|
|
|
|||||||||||||||||
Our investments at fair value consisted of the following industry classifications as of March 31, 2017 and 2016:
| March 31, 2017 | March 31, 2016 | |||||||||||||||
| Fair Value | Percentage of Total Investments |
Fair Value | Percentage of Total Investments |
|||||||||||||
| Home and Office Furnishings, Housewares, and Durable Consumer Products |
$ | 93,062 | 18.6 | % | $ | 86,811 | 17.8 | % | ||||||||
| Diversified/Conglomerate Service |
85,248 | 17.0 | 49,901 | 10.2 | ||||||||||||
| Chemicals, Plastics, and Rubber |
65,156 | 13.0 | 90,602 | 18.6 | ||||||||||||
| Diversified/Conglomerate Manufacturing |
40,303 | 8.0 | 64,986 | 13.3 | ||||||||||||
| Leisure, Amusement, Motion Pictures, Entertainment |
32,453 | 6.5 | 43,330 | 8.9 | ||||||||||||
| Automobile |
20,792 | 4.1 | 24,402 | 5.0 | ||||||||||||
| Textiles and Leather |
20,369 | 4.1 | 11,995 | 2.5 | ||||||||||||
| Farming and Agriculture |
19,096 | 3.8 | 21,005 | 4.3 | ||||||||||||
| Personal and Non-Durable Consumer Products (Manufacturing Only) |
19,011 | 3.8 | 315 | 0.1 | ||||||||||||
| Containers, Packaging, and Glass |
18,266 | 3.6 | 20,108 | 4.1 | ||||||||||||
| Machinery (Non-agriculture, Non-construction, Non-electronic) |
17,283 | 3.4 | 20,011 | 4.1 | ||||||||||||
| Aerospace and Defense |
16,042 | 3.2 | 10,000 | 2.1 | ||||||||||||
| Cargo Transport |
15,891 | 3.2 | 14,484 | 3.0 | ||||||||||||
| Beverage, Food, and Tobacco |
14,802 | 3.0 | 9,050 | 1.8 | ||||||||||||
| Telecommunications |
14,000 | 2.8 | 14,000 | 2.9 | ||||||||||||
| Other < 2.0% |
9,805 | 1.9 | 6,656 | 1.3 | ||||||||||||
|
|
|
|
|
|
|
|
|
|||||||||
| Total investments |
$ | 501,579 | 100.0 | % | $ | 487,656 | 100.0 | % | ||||||||
|
|
|
|
|
|
|
|
|
|||||||||
5
Our investments at fair value were included in the following U.S. geographic regions as of March 31, 2017 and 2016:
| March 31, 2017 | March 31, 2016 | |||||||||||||||
| Fair Value | Percentage of Total Investments |
Fair Value | Percentage of Total Investments |
|||||||||||||
| South |
$ | 175,136 | 34.9 | % | $ | 129,934 | 26.6 | % | ||||||||
| Northeast |
159,614 | 31.8 | 183,265 | 37.6 | ||||||||||||
| West |
123,475 | 24.6 | 124,713 | 25.6 | ||||||||||||
| Midwest |
43,354 | 8.7 | 49,744 | 10.2 | ||||||||||||
|
|
|
|
|
|
|
|
|
|||||||||
| Total investments |
$ | 501,579 | 100.0 | % | $ | 487,656 | 100.0 | % | ||||||||
|
|
|
|
|
|
|
|
|
|||||||||
The geographic region indicates the location of the headquarters for our portfolio companies. A portfolio company may have additional business locations in other geographic regions.
Investment Process
Overview of Investment and Approval Process
To originate investments, the Adviser’s investment professionals use an extensive referral network comprised primarily of private equity sponsors, venture capitalists, leveraged buyout funds, investment bankers, attorneys, accountants, commercial bankers and business brokers. The Adviser’s investment professionals review information received from these and other sources in search of potential financing opportunities. If a potential opportunity matches our investment objectives, the investment professionals will seek an initial screening of the opportunity with our president, David Dullum, to authorize the submission of an indication of interest (“IOI”) to the prospective portfolio company. If the prospective portfolio company passes this initial screening and the IOI is accepted by the prospective company, the investment professionals will seek approval to issue a letter of intent (“LOI”) from the Adviser’s investment committee, which is composed of Messrs. Gladstone, Brubaker, and Dullum, to the prospective company. If this LOI is issued, then the Adviser and Gladstone Securities, LLC (“Gladstone Securities”) (collectively, the “Due Diligence Team”) will conduct a due diligence investigation and create a detailed profile summarizing the prospective portfolio company’s historical financial statements, industry, competitive position and management team and analyzing its conformity to our general investment criteria. The investment professionals then present this profile to the Adviser’s investment committee, which must approve each investment. Further, each investment is available for review by the members of our Board of Directors, a majority of whom are not “interested persons” as defined in Section 2(a)(19) of the 1940 Act, and our Board of Directors reviews and approves any investments we may make pursuant to the Co-Investment Order.
Prospective Portfolio Company Characteristics
We have identified certain characteristics that we believe are important in identifying and investing in prospective portfolio companies. The criteria listed below provide general guidelines for our investment decisions, although not all of these criteria may be met by each portfolio company.
| • | Experienced Management: We typically require that the businesses in which we invest have experienced management teams or a hiring plan in place to install an experienced management team. We also require the businesses to have in place proper incentives to induce management to succeed and act in concert with our interests as investors, including having significant equity or other interests in the financial performance of their companies. |
| • | Value-and-Income Orientation and Positive Cash Flow: Our investment philosophy places a premium on fundamental analysis from an investor’s perspective and has a distinct value and income orientation. In seeking value, we focus on established companies in which we can invest at relatively low multiples of EBITDA, and that have positive operating cash flow at the time of investment. In seeking income, we typically invest in companies that generate relatively stable to growing sales, cash flows, and EBITDA to fixed charges coverage, which provides some assurance that the borrowers will be able to service their debt. We do not expect to invest in start-up companies or companies with what we believe to be speculative business plans. |
| • | Strong Competitive Position in an Industry: We seek to invest in businesses that have developed strong market positions and significant relative market share within their respective markets and that we believe are well-positioned to capitalize on growth opportunities. We seek businesses that demonstrate significant competitive advantages versus their competitors, which we believe will help to protect their market positions and profitability. |
| • | Liquidation Value of Assets: The projected liquidation value of the assets, if any, is an important factor in our investment analysis in collateralizing our debt securities. |
6
Extensive Due Diligence
The Due Diligence Team conducts what we believe are extensive due diligence investigations of our prospective portfolio companies and investment opportunities. The due diligence investigation may begin with a review of publicly available information followed by in-depth business analysis, including, but not limited to, some or all of the following:
| • | A review of the prospective portfolio company’s historical and projected financial information, including a quality of earnings analysis; |
| • | Visits to the prospective portfolio company’s business site(s) and evaluation of potential environmental issues; |
| • | Interviews with the prospective portfolio company’s management, employees, customers and vendors; |
| • | Review of loan documents and material contracts; |
| • | Background checks and a management capabilities assessment on the prospective portfolio company’s management team; and |
| • | Research, including market analyses, on the prospective portfolio company’s products, services or particular industry and its competitive position therein. |
Additional due diligence of a potential investment may be conducted on our behalf by attorneys and independent accountants, as well as other outside advisers, prior to the closing of the investment, as appropriate.
Investment Structure
Once the Adviser has determined that an investment meets our standards and investment criteria, the Adviser works with the management of that company and other capital providers to structure the transaction in a way that we believe will provide us with the greatest opportunity to maximize our return on the investment, while providing appropriate incentives to management of the company. As discussed above, the capital classes through which we typically structure a deal include first lien secured debt, second lien secured debt, and preferred and common equity or equivalents. Through its risk management process, the Adviser seeks to limit the downside risk of our investments by:
| • | Making investments with an expected total return (including interest, yield enhancements and potential equity appreciation) that it believes compensates us for the credit risk of the investment; |
| • | Seeking collateral or superior positions in the portfolio company’s capital structure where possible; |
| • | Incorporating put and call protection rights into the investment structure where possible; |
| • | Negotiating covenants in connection with our investments that afford our portfolio companies as much flexibility as possible in managing their businesses, while also preserving our capital; and |
| • | Holding board seats or securing board observation rights at the portfolio company. |
We expect to hold most of our debt investments until maturity or repayment. From time to time, we may sell our investments (including our equity investments) earlier if a liquidity event takes place, such as a recapitalization of a portfolio company, an initial public offering, or a sale to a third party, including strategic buyers, private equity funds, or existing investors in the portfolio company, and which may be privately negotiated transactions.
Competitive Advantages
A large number of entities compete with us and make the types of investments that we seek to make in Lower Middle Market companies. Such competitors include private equity funds, leveraged buyout funds, other BDCs, venture capital funds, investment banks and other equity and non-equity based investment funds, and other financing sources, including traditional financial services
7
companies such as commercial banks. Many of our competitors are substantially larger than we are and have considerably greater funding sources or are able to access capital more cost effectively. In addition, certain of our competitors may have higher risk tolerances or different risk assessments, which could allow them to consider a wider variety of investments, and establish a larger portfolio of investments. Furthermore, many of these competitors are not subject to the regulatory restrictions that the 1940 Act imposes on us as a BDC. However, we believe that we have the following competitive advantages over many other providers of financing to Lower Middle Market companies.
Management Expertise
Our Adviser has an investment committee for each of the Company and the Affiliated Public Funds. Mr. Gladstone and Mr. Brubaker serve as members of the Adviser’s investment committees for each of the Company and each of the Affiliated Public Funds. Mr. Gladstone and Mr. Dullum have extensive experience in investing in Lower Middle Market companies and with operating in the BDC marketplace in general. Mr. Brubaker has substantial experience in acquisitions and operations of companies. These three individuals comprising our executive management dedicate a significant portion of their time to managing our investment portfolio. They have extensive experience providing capital to Lower Middle Market companies and have worked together at the Gladstone family of companies for more than ten years. In addition, we have access to the resources and expertise of the Adviser’s investment professionals and support staff who possess a broad range of transactional, financial, managerial, and investment skills.
Increased Access to Investment Opportunities Developed Through Extensive Research Capability and Network of Contacts
The Adviser seeks to identify potential investments through active origination and due diligence and through its dialogue with numerous management teams, members of the financial community and potential corporate partners with whom the Adviser’s investment professionals have long-term relationships. We believe that the Adviser’s investment professionals have developed a broad network of contacts within the investment, commercial banking, private equity and investment management communities, and that their reputation, experience, and focus on investing in Lower Middle Market companies enables us to source and identify well-positioned prospective portfolio companies, which provide attractive investment opportunities. Additionally, the Adviser expects to generate information from its professionals’ network of accountants, consultants, lawyers and management teams of portfolio companies and other companies to support the Adviser’s investment activities.
Disciplined, Value and Income-Oriented Investment Philosophy with a Focus on Preservation of Capital
In making its investment decisions, the Adviser focuses on the risk and reward profile of each prospective portfolio company, seeking to minimize the risk of capital loss without foregoing the potential for capital appreciation. We expect the Adviser to use the same value and income-oriented investment philosophy that its professionals use in the management of the other Gladstone Companies and to commit resources to manage downside exposure. The Adviser’s approach seeks to reduce our risk in investments by using some or all of the following approaches:
| • | Focusing on companies with attractive and sustainable market positions and cash flow; |
| • | Investing in businesses with experienced and established management teams; |
| • | Engaging in extensive due diligence from the perspective of a long-term investor; |
| • | Investing at low price-to-cash flow multiples; and |
| • | Adopting flexible transaction structures by drawing on the experience of the investment professionals of the Adviser and its affiliates. |
Longer Investment Horizon
Unlike private equity and venture capital funds that are typically organized as finite-life partnerships, we are not subject to standard periodic capital return requirements. The partnership agreements of most private equity and venture capital funds typically provide that these funds may only invest investors’ capital once and must return all capital and realized gains to investors within a finite time period, often seven to ten years. These provisions often force private equity and venture capital funds to seek returns on their investments by causing their portfolio companies to pursue mergers, public equity offerings, or other liquidity events more quickly than might otherwise be optimal or desirable, potentially resulting in a lower overall return to investors and/or an adverse impact on their portfolio companies. In contrast, we are a corporation of perpetual duration and are exchange-traded. We believe that our flexibility to make investments with a long-term view and without the capital return requirements of traditional private investment vehicles provides us with the opportunity to achieve greater long-term returns on invested capital.
8
Flexible Transaction Structuring
We believe the Adviser’s and our management team’s broad expertise and its ability to draw upon many years of combined experience enables the Adviser to identify, assess, and structure investments successfully across all levels of a prospective portfolio company’s capital structure and manage potential risk and return at all stages of the economic cycle. We are not subject to many of the regulatory limitations that govern traditional lending institutions, such as banks. As a result, we are flexible in selecting and structuring investments, adjusting investment criteria and transaction structures and, in some cases, the types of securities in which we invest, thereby affording us a competitive advantage of providing both, equity and debt financing, which may limit uncertainty related to the close of the transaction and the risk of refinancing during periods of market yield compression. We believe that this approach enables the Adviser to develop a financing structure which best fits the investment and growth profile of the underlying business and yields attractive investment opportunities that will continue to generate current income and capital gain potential throughout the economic cycle, including during turbulent periods in the capital markets.
Ongoing Management of Investments and Portfolio Company Relationships
The Adviser’s investment professionals actively oversee each investment by continuously evaluating the portfolio company’s performance and typically working collaboratively with the portfolio company’s management to identify and incorporate best resources and practices that help us achieve our projected investment performance.
Monitoring
The Adviser’s investment professionals monitor the financial performance, trends, and changing risks of each portfolio company on an ongoing basis to determine if each portfolio company is performing within expectations and to guide the portfolio company’s management in taking the appropriate courses of action. The Adviser employs various methods of evaluating and monitoring the performance of our investments in portfolio companies, which can include the following:
| • | Monthly analysis of financial and operating performance; |
| • | Frequent assessment of the portfolio company’s performance against its business plan and our investment expectations; |
| • | Attendance at and/or participation in the portfolio company’s board of directors or management meetings; |
| • | Continuous assessment of portfolio company management, governance and strategic direction; |
| • | Continuous assessment of the portfolio company’s industry and competitive environment; and |
| • | Frequent review and assessment of the portfolio company’s operating outlook and financial projections. |
Relationship Management
The Adviser’s investment professionals interact with various parties involved with a portfolio company, or investment, by actively engaging with internal and external constituents, including:
| • | Management; |
| • | Boards of directors; |
| • | Financial sponsors; |
| • | Capital partners; |
| • | Auditors; and |
| • | Advisers and consultants. |
9
Managerial Assistance and Services
As a BDC, we make available significant managerial assistance, as defined in the 1940 Act, to our portfolio companies and provide other services (other than such managerial assistance) to such portfolio companies. Neither we, nor the Adviser, currently receive fees in connection with the managerial assistance we make available. At times, the Adviser may also provide other services to our portfolio companies under certain agreements and may receive fees for services other than managerial assistance. Such services may include, but are not limited to: (i) assistance obtaining, sourcing or structuring credit facilities, long term loans or additional equity from unaffiliated third parties; (ii) negotiating important contractual financial relationships; (iii) consulting services regarding restructuring of the portfolio company and financial modeling as it relates to raising additional debt and equity capital from unaffiliated third parties; and (iv) primary role in interviewing, vetting and negotiating employment contracts with candidates in connection with adding and retaining key portfolio company management team members. The Adviser voluntarily, unconditionally, and irrevocably credits 100% of these fees against the base management fee that we would otherwise be required to pay to the Adviser as discussed below in “— Transactions with Related Parties — Investment Advisory and Management Agreement — Base Management Fee;” however, pursuant to the terms of the Advisory Agreement, a small percentage of certain of such fees is retained by the Adviser in the form of reimbursement, at cost, for tasks completed by personnel of the Adviser, primarily for the valuation of portfolio companies.
In February 2011, Gladstone Securities started providing other services (such as investment banking and due diligence services) to certain of our portfolio companies, see “— Transactions with Related Parties — Other Transactions” below.
Valuation Process
The following is a general description of our investment valuation policy (the “Policy”) (which has been approved by our Board of Directors) that the professionals of the Adviser and Administrator, with oversight and direction from our chief valuation officer, an employee of the Administrator that reports directly to our Board of Directors, (collectively, the “Valuation Team”) use each quarter to determine the fair value of our investment portfolio. In accordance with the 1940 Act, our Board of Directors has the ultimate responsibility for reviewing and approving, in good faith, the fair value of our investments based on the Policy. The Adviser values our investments in accordance with the requirements of the 1940 Act and accounting principles generally accepted in the U.S. (“GAAP”). There is no single standard for determining fair value (especially for privately-held businesses), as fair value depends upon the specific facts and circumstances of each individual investment. Each quarter, our Board of Directors reviews the Policy to determine if changes thereto are advisable and assesses whether the Valuation Team has applied the Policy consistently. With respect to the valuation of our investment portfolio, the Valuation Team performs the following steps each quarter:
| • | Each investment is initially assessed by the Valuation Team using the Policy, which may include: |
| • | Obtaining fair value quotes or utilizing valuation inputs from third party valuation firms; and |
| • | Using techniques, such as total enterprise value, yield analysis, market quotes and other factors, including but not limited to: the nature and realizable value of the collateral, including external parties’ guaranties; any relevant offers or letters of intent to acquire the portfolio company; and the markets in which the portfolio company operates. |
| • | Preliminary valuation conclusions are then discussed amongst the Valuation Team and with our management and documented for review by our Board of Directors. Written valuation recommendations and supporting material are sent to the Board of Directors in advance of the quarterly meetings. |
| • | The Valuation Committee of the Board of Directors (comprised entirely of independent directors) meets to review this documentation and discusses the information provided by our Valuation Team, and determines whether the Valuation Team has followed the Policy, determines whether the Valuation Team’s recommended fair value is reasonable in light of the Policy and reviews other facts and circumstances. Then, the Valuation Committee and chief valuation officer present the Valuation Committee’s findings to the entire Board of Directors, so that the full Board of Directors may review and approve, with a vote, to accept or reject the fair value recommendations in accordance with the Policy. |
Fair value measurements of our investments may involve subjective judgment and estimates. Due to the uncertainty inherent in valuing these securities, the Valuation Team’s determinations of fair value may fluctuate from period to period and may differ materially from the values that could be obtained if a ready market for these securities existed. Our NAV could be materially affected if the Valuation Team’s determinations regarding the fair value of our investments are materially different from the values that we ultimately realize upon our disposal of such securities. Our valuation policies, procedures and processes are more fully described under “Management’s Discussion and Analysis of Financial Condition and Results of Operations — Critical Accounting Policies — Investment Valuation.”
10
Transactions with Related Parties
Investment Advisory and Management Agreement
Pursuant to our Advisory Agreement, we pay the Adviser certain fees as compensation for its services, consisting of a base management fee and an incentive fee, each as described below. On July 12, 2016, our Board of Directors, including a majority of the directors who are not parties to the Advisory Agreement or interested persons of such party, approved the annual renewal of the Advisory Agreement through August 31, 2017. Our Board of Directors considered the following factors as the basis for its decision to renew the Advisory Agreement: (1) the nature, extent and quality of services provided by the Adviser to our stockholders; (2) the investment performance of the Company and the Adviser, (3) the costs of the services to be provided and profits to be realized by the Adviser and its affiliates from the relationship with the Company, (4) the extent to which economies of scale will be realized as the Company and the Affiliated Public Funds grow and whether the fee level under the Advisory Agreement reflects the economies of scale for the Company’s investors, (5) the fee structure of the advisory and administrative agreements of comparable funds, and (6) indirect profits to the Adviser created through the Company and (7) in light of the foregoing considerations, the overall fairness of the advisory fee paid under the Advisory Agreement.
Base Management Fee
The base management fee is payable quarterly to the Adviser pursuant to our Advisory Agreement and is assessed at an annual rate of 2.0%, computed on the basis of the value of our average gross assets at the end of the two most recently completed quarters (inclusive of the current quarter), which are total assets, including investments made with proceeds of borrowings, less any uninvested cash or cash equivalents resulting from borrowings, and adjusted appropriately for any share issuances or repurchases during the period.
Additionally, as stated above, pursuant to the requirements of the 1940 Act, the Adviser makes available significant managerial assistance to our portfolio companies. The Adviser may also provide other services to our portfolio companies under certain agreements and may receive fees for services other than managerial assistance. The Adviser voluntarily, unconditionally, and irrevocably credits 100% of these fees against the base management fee that we would otherwise be required to pay to the Adviser; however, pursuant to the terms of the Advisory Agreement, a small percentage of certain of such fees is retained by the Adviser in the form of reimbursement, at cost, for tasks completed by personnel of the Adviser, primarily for the valuation of portfolio companies. Loan servicing fees that are payable to the Adviser pursuant to our Fifth Amended and Restated Credit Agreement, as amended (the “Credit Facility”), are also 100% credited against the base management fee as discussed below “— Loan Servicing Fee Pursuant to Credit Facility.”
Incentive Fee
The incentive fee payable to the Adviser under our Advisory Agreement consists of two parts: an income-based incentive fee and a capital gains-based incentive fee.
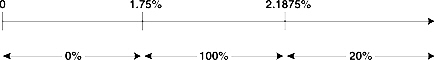
The income-based incentive fee rewards the Adviser if our quarterly net investment income (before giving effect to any incentive fee) exceeds 1.75% of our net assets, adjusted appropriately for any share issuances or repurchases during the period (the “Hurdle Rate”). The income-based incentive fee with respect to our pre-incentive fee net investment income is payable quarterly to the Adviser and is computed as follows:
| • | No incentive fee in any calendar quarter in which our pre-incentive fee net investment income does not exceed the Hurdle Rate (7.0% annualized); |
| • | 100.0% of our pre-incentive fee net investment income with respect to that portion of such pre-incentive fee net investment income, if any, that exceeds the Hurdle Rate but is less than 2.1875% of our net assets, adjusted appropriately for any share issuances or repurchases during the period, in any calendar quarter (8.75% annualized); and |
| • | 20.0% of the amount of our pre-incentive fee net investment income, if any, that exceeds 2.1875% of our net assets, adjusted appropriately for any share issuances or repurchases during the period, in any calendar quarter (8.75% annualized). |
11
Quarterly Incentive Fee Based on Net Investment Income
Pre-incentive fee net investment income
(expressed as a percentage of the value of net assets)
Percentage of pre-incentive fee net investment income
allocated to income-related portion of incentive fee
The second part of the incentive fee is a capital gains-based incentive fee that is determined and payable in arrears as of the end of each fiscal year (or upon termination of the Advisory Agreement, as of the termination date), and equals 20.0% of our realized capital gains, less any realized capital losses and unrealized depreciation, calculated as of the end of the preceding calendar year. The capital gains-based incentive fee payable to the Adviser is calculated based on (i) cumulative aggregate realized capital gains since our inception, less (ii) cumulative aggregate realized capital losses since our inception, less (iii) the entire portfolio’s aggregate unrealized capital depreciation, if any, as of the date of the calculation. If this number is positive at the applicable calculation date, then the capital gains-based incentive fee for such year equals 20.0% of such amount, less the aggregate amount of any capital gains-based incentive fees paid in respect of our portfolio in all prior years. For calculation purposes, cumulative aggregate realized capital gains, if any, equals the sum of the excess between the net sales price of each investment, when sold, and the original cost of such investment since our inception. Cumulative aggregate realized capital losses equals the sum of the deficit between the net sales price of each investment, when sold, and the original cost of such investment since our inception. The entire portfolio’s aggregate unrealized capital depreciation, if any, equals the sum of deficit between the fair value of each investment security as of the applicable calculation date and the original cost of such investment security. We have not incurred capital gains-based incentive fees from inception through March 31, 2017, as aggregate unrealized capital depreciation has exceeded cumulative realized capital gains net of cumulative realized capital losses.
Additionally, in accordance with GAAP, a capital gains-based incentive fee accrual is calculated using the aggregate realized capital gains and losses and aggregate unrealized capital depreciation included in the calculation of the capital gains-based incentive fee plus the aggregate unrealized capital appreciation. If such amount is positive at the end of a reporting period, then GAAP requires us to record a capital gains-based incentive fee equal to 20.0% of such amount, less the aggregate amount of actual capital gains-based incentive fees paid in all prior years. If such amount is negative, then there is no accrual for such period. GAAP requires that the capital gains-based incentive fee accrual consider the aggregate unrealized capital appreciation in the calculation, as a capital gains-based incentive fee would be payable if such unrealized capital appreciation were realized. There can be no assurance that any such unrealized capital appreciation will be realized in the future. There has been no GAAP accrual recorded for a capital gains-based incentive fee since our inception through March 31, 2017.
Our Board of Directors may accept non-contractual, unconditional, and irrevocable credits from the Adviser to reduce the income-based incentive fee to the extent net investment income generated in the current or prior year does not cover 100% of the distributions to common stockholders for a year. For the years ended March 31, 2017, 2016 and 2015, there were no such incentive fee credits from the Adviser.
Loan Servicing Fee Pursuant to Credit Facility
The Adviser also services the loans held by our wholly-owned subsidiary, Gladstone Business Investment, LLC (“Business Investment”) (the borrower under the Credit Facility), in return for which the Adviser receives a 2.0% annual fee based on the monthly aggregate outstanding balance of loans pledged under the Credit Facility. Since Business Investment is a consolidated subsidiary of ours, coupled with the fact that the total base management fee paid to the Adviser pursuant to the Advisory Agreement cannot exceed 2.0% of total assets (as reduced by cash and cash equivalents pledged to creditors) during any given calendar year, we treat payment of the loan servicing as a pre-payment of the base management fee under the Advisory Agreement. Accordingly, these loan servicing fees are 100% voluntarily, unconditionally, and irrevocably credited back to us by the Adviser.
Administration Agreement
We pay the Administrator pursuant to the Administration Agreement for our allocable portion of the Administrator’s expenses incurred while performing services to us, which are primarily rent and salaries and benefits expenses of the Administrator’s employees, including, but not limited to, our chief financial officer and treasurer, chief valuation officer, chief compliance officer and general counsel and secretary (who also serves as the Administrator’s president) and their respective staffs. Prior to July 1, 2014, our
12
allocable portion of the expenses was generally derived by multiplying that portion of the Administrator’s expenses allocable to all funds managed by the Adviser and serviced by the Administrator by the percentage of our total assets at the beginning of each quarter in comparison to the total assets at the beginning of each quarter of all funds managed by the Adviser and serviced by the Administrator.
Effective July 1, 2014, our allocable portion of the Administrator’s expenses are generally derived by multiplying the Administrator’s total expenses by the approximate percentage of time during the current quarter the Administrator’s employees performed services for us in relation to their time spent performing services for all companies serviced by the Administrator. These administrative fees are accrued at the end of the quarter when the services are performed and recorded in our accompanying Consolidated Statements of Operations and generally paid the following quarter. On July 12, 2016, our Board of Directors approved the annual renewal of the Administration Agreement through August 31, 2017.
Other Transactions
Mr. Gladstone also serves on the board of managers of our affiliate, Gladstone Securities, a privately-held broker-dealer registered with the Financial Industry Regulatory Authority and insured by the Securities Investor Protection Corporation. Gladstone Securities is 100% indirectly owned and controlled by Mr. Gladstone and has provided other services, such as investment banking and due diligence services, to certain of our portfolio companies, for which Gladstone Securities receives a fee. Any such fees paid by portfolio companies to Gladstone Securities do not impact the fees we pay to the Adviser or the non-contractual, unconditional, and irrevocable credits against the base management fee. For additional information refer to Note 4 — Related Party Transactions of the notes to our accompanying Consolidated Financial Statements.
Material U.S. Federal Income Tax Considerations
RIC Status
To qualify for treatment as a RIC under Subchapter M of the Code, we must generally distribute to our stockholders, for each taxable year, at least 90% of our taxable ordinary income plus the excess of our net short-term capital gains over net long-term capital losses (“Investment Company Taxable Income”). We refer to this as the “annual distribution requirement.” We must also meet several additional requirements, including:
| • | Business Development Company status: At all times during the taxable year, we must maintain our status as a BDC. |
| • | Income source requirements: At least 90% of our gross income for each taxable year must be from dividends, interest, payments with respect to securities loans, gains from sales or other dispositions of securities or other income derived with respect to our business of investing in securities, and net income derived from an interest in a qualified, publicly-traded partnership. |
| • | Asset diversification requirements: As of the close of each quarter of our taxable year: (1) at least 50% of the value of our assets must consist of cash, cash items, U.S. government securities, the securities of other regulated investment companies and other securities to the extent that (a) we do not hold more than 10% of the outstanding voting securities of an issuer of such other securities and (b) such other securities of any one issuer do not represent more than 5% of our total assets (the “50% threshold”), and (2) no more than 25% of the value of our total assets may be invested in the securities of one issuer (other than U.S. government securities or the securities of other regulated investment companies), or of two or more issuers that are controlled by us and are engaged in the same or similar or related trades or businesses or in the securities of one or more qualified, publicly-traded partnerships. |
Failure to Qualify as a RIC
If we are unable to qualify for treatment as a RIC, we would be subject to tax on all of our taxable income at regular corporate rates. We would not be able to deduct distributions to stockholders, nor would we be required to make such distributions. Distributions would be taxable to our stockholders as dividend income to the extent of our current and accumulated earnings and profits. Subject to certain limitations under the Code, corporate distributees would be eligible for the dividends received deduction. Distributions in excess of our current and accumulated earnings and profits would be treated first as a return of capital to the extent of the stockholder’s adjusted tax basis, and then as a gain realized from the sale or exchange of property. If we fail to meet the RIC requirements for more than two consecutive years and then seek to requalify as a RIC, we generally would be subject to corporate-level federal income tax on any unrealized appreciation with respect to our assets to the extent that any such unrealized appreciation is recognized during the five-year period commencing on the first date on which we requalify as a RIC.
13
Qualification as a RIC
If we qualify as a RIC and distribute to stockholders each year in a timely manner at least 90% of our Investment Company Taxable Income, we will not be subject to federal income tax on the portion of our taxable income and gains we distribute to stockholders. We would, however, be subject to a 4% nondeductible federal excise tax if we do not distribute, actually or on a deemed basis, an amount at least equal to the sum of (i) 98% of our ordinary income for the calendar year, (ii) 98.2% of our capital gains in excess of capital losses for the one-year period ending on October 31 of the calendar year and (iii) any ordinary income and capital gains in excess of capital losses for preceding years that were not distributed during such years. For the years ended December 31, 2016, 2015 and 2014, we incurred $0.4 million, $0.2 million and $0.1 million, respectively, in excise taxes. As of March 31, 2017, our capital loss carryforward was $0.
We will be subject to regular corporate income tax, currently at rates up to 35%, on any income that is not distributed or deemed to be distributed, including both ordinary income and capital gains. We may retain some or all of our net long-term capital gains, if any, but we generally intend to distribute such gains to stockholders in cash or retain and designate them as deemed distributions. Among other consequences, we will pay federal tax on the retained net long-term capital gains, each stockholder will be required to include its share of the deemed distribution in income as if it had been actually distributed to the stockholder and the stockholder will be entitled to claim a credit or refund equal to its allocable share of the tax we pay on the retained long-term capital gain. The amount of the deemed distribution, net of such tax, will be added to the stockholder’s tax basis for its stock. Since we expect to pay federal tax on any retained long-term capital gains at our regular corporate capital gain tax rate, and since that rate is in excess of the maximum rate currently payable by individuals on long-term capital gains, the amount of tax that individual stockholders will be treated as having paid will exceed the tax they owe on the capital gain dividend and such excess may be claimed as a credit or refund against the stockholder’s other tax obligations. A stockholder that is not subject to U.S. federal income tax or tax on long-term capital gains would be required to file a U.S. federal income tax return on the appropriate form in order to claim a refund for the taxes we paid. In order to utilize the deemed distribution approach, we must provide written notice to the stockholders after the close of the relevant tax year. We will also be subject to alternative minimum tax, but any tax preference items would be apportioned between us and our stockholders in the same proportion that distributions, other than capital gain dividends, paid to each stockholder bear to our taxable income determined without regard to the dividends paid deduction. As of March 31, 2017, we have never made a deemed distribution.
Taxation of Our U.S. Stockholders
Distributions
For any period during which we qualify as a RIC for federal income tax purposes, distributions to our stockholders attributable to our Investment Company Taxable Income generally will be taxable as ordinary income to stockholders to the extent of our current or accumulated earnings and profits. We first allocate our earnings and profits to distributions to our preferred stockholders and then to distributions to our common stockholders based on priority in our capital structure. Any distributions in excess of our earnings and profits will first be treated as a return of capital to the extent of the stockholder’s adjusted basis in his or her shares of stock and thereafter as gain from the sale of shares of our stock. Distributions of our long-term capital gains, reported by us as such, will be taxable to stockholders as long-term capital gains regardless of the stockholder’s holding period of the stock and whether the distributions are paid in cash or invested in additional stock. Corporate stockholders are generally eligible for the 70% dividends received deduction with respect to dividends received from us, other than capital gains dividends, but only to the extent such amount is attributable to dividends received by us from taxable domestic corporations.
The Internal Revenue Service currently requires that a RIC that has two or more classes of stock allocate to each class proportionate amounts of each type of its income (such as ordinary income, capital gains, qualified dividend income and dividends qualifying for the dividends-received deduction) based upon the percentage of total distributions paid to each class for the tax year. Accordingly, we intend to allocate capital gain distributions and distributions of qualified dividend income and distributions qualifying for the dividends-received deduction, if any, between our common shares and preferred shares in proportion to the total distributions paid to each class with respect to such tax year.
Any distribution declared by us in October, November or December of any calendar year, payable to stockholders of record on a specified date in such a month and actually paid during January of the following year, will be treated as if it were paid by us and received by the stockholders on December 31 of the previous year. In addition, we may elect (in accordance with Section 855(a) of the Code) to relate a distribution back to the prior taxable year if we (1) declare such distribution prior to the later of the due date for filing our return for that taxable year or the 15th day of the ninth month following the close of the taxable year, (2) make the election in that return, and (3) distribute the amount in the 12-month period following the close of the taxable year but not later than the first regular distribution payment of the same type following the declaration. Any such election will not alter the general rule that a stockholder will be treated as receiving a distribution in the taxable year in which the distribution is made, subject to the October, November, December rule described above. As of March 31, 2017, our Section 855(a) distributions were $8.2 million.
14
If a common stockholder participates in our “opt in” dividend reinvestment plan, any distributions reinvested under the plan will be taxable to the common stockholder to the same extent, and with the same character, as if the common stockholder had received the distribution in cash. The common stockholder will have an adjusted basis in the additional common shares purchased through the plan equal to the amount of the reinvested distribution. The additional common shares will have a new holding period commencing on the day following the day on which the shares are credited to the common stockholder’s account. The plan agent purchases shares in the open market in connection with the obligations under the plan. We do not have a dividend reinvestment plan for our preferred stockholders.
Sale of Our Shares
A U.S. stockholder generally will recognize taxable gain or loss if the U.S. stockholder sells or otherwise disposes of the shares of our common or preferred stock. Any gain arising from such sale or disposition generally will be treated as long-term capital gain or loss if the U.S. stockholder has held the shares for more than one year. Otherwise, it will be classified as short-term capital gain or loss. However, any capital loss arising from the sale or disposition of shares of our stock held for six months or less will be treated as long-term capital loss to the extent of the amount of capital gain dividends received, or undistributed capital gain deemed received, with respect to such shares. Under the tax laws in effect as of the date of this filing, individual U.S. stockholders are subject to a maximum federal income tax rate of 20% on their net capital gain (i.e. the excess of realized net long-term capital gain over realized net short-term capital loss for a taxable year) including any long-term capital gain derived from an investment in our shares. Such rate is lower than the maximum rate on ordinary income currently payable by individuals. Corporate U.S. stockholders currently are subject to federal income tax on net capital gain at the same rates applied to their ordinary income (currently up to a maximum of 35%). Capital losses are subject to limitations on use for both corporate and non-corporate stockholders. Certain U.S. stockholders who are individuals, estates or trusts generally are subject to a 3.8% Medicare tax on, among other things, dividends on and capital gain from the sale or other disposition of shares of our stock.
Backup Withholding and Other Required Withholding
We may be required to withhold federal income tax, or backup withholding, currently at a rate of 28%, from all taxable distributions to any non-corporate U.S. stockholder (i) who fails to furnish us with a correct taxpayer identification number or a certificate that such stockholder is exempt from backup withholding, or (ii) with respect to whom the Internal Revenue Service (“IRS”) notifies us that such stockholder has failed to properly report certain interest and dividend income to the IRS and to respond to notices to that effect. An individual’s taxpayer identification number is generally his or her social security number. Any amount withheld under backup withholding is allowed as a credit against the U.S. stockholder’s federal income tax liability, provided that proper information is provided to the IRS.
The Foreign Account Tax Compliance Act imposes a federal withholding tax on certain types of payments made to “foreign financial institutions” and certain other non-U.S. entities unless certain due diligence, reporting, withholding, and certification obligation requirements are satisfied. Under delayed effective dates provided for in the Treasury Regulations and other IRS guidance, such required withholding will not begin until January 1, 2019 with respect to gross proceeds from a sale or other disposition of our stock.
Regulation as a BDC
We are a closed-end, non-diversified management investment company that has elected to be regulated as a BDC under Section 54 of the 1940 Act. As such, we are subject to regulation under the 1940 Act. The 1940 Act contains prohibitions and restrictions relating to transactions between BDCs and their affiliates, principal underwriters and affiliates of those affiliates or underwriters and requires that a majority of the directors be persons other than “interested persons,” as defined in the 1940 Act. In addition, the 1940 Act provides that we may not change the nature of our business so as to cease to be, or to withdraw our election as, a BDC unless approved by a majority of our outstanding “voting securities,” as defined in the 1940 Act.
We intend to conduct our business so as to retain our status as a BDC. A BDC may use capital provided by public stockholders and from other sources to make long-term private investments in businesses. A BDC provides stockholders the ability to retain the liquidity of a publicly-traded stock, while sharing in the possible benefits, if any, of investing in primarily privately owned companies. In general, a BDC must have been organized and have its principal place of business in the U.S. and must be operated for the purpose of making investments in qualifying assets, as described in Sections 55(a)(1) — through (a)(3) of the 1940 Act.
15
Qualifying Assets
Under the 1940 Act, a BDC may not acquire any asset other than assets of the type listed in Section 55(a) of the 1940 Act, which are referred to as qualifying assets, unless, at the time the acquisition is made, qualifying assets, other than certain interests in furniture, equipment, real estate, or leasehold improvements (“Operating Assets”) represent at least 70% of total assets, exclusive of Operating Assets. The types of qualifying assets in which we may invest under the 1940 Act include, but are not limited to, the following:
| (1) | Securities purchased in transactions not involving any public offering from the issuer of such securities, which issuer is an eligible portfolio company. An eligible portfolio company is generally defined in the 1940 Act as any issuer which: |
| (a) | Is organized under the laws of, and has its principal place of business in, any State or States in the U.S.; |
| (b) | Is not an investment company (other than a small business investment company wholly owned by the BDC or otherwise excluded from the definition of investment company); and |
| (c) | Satisfies one of the following: |
| (i) | It does not have any class of securities with respect to which a broker or dealer may extend margin credit; |
| (ii) | It is controlled by the BDC and for which an affiliate of the BDC serves as a director; |
| (iii) | It has total assets of not more than $4 million and capital and surplus of not less than $2 million; |
| (iv) | It does not have any class of securities listed on a national securities exchange; or |
| (v) | It has a class of securities listed on a national securities exchange, with an aggregate market value of outstanding voting and non-voting equity of less than $250 million. |
| (2) | Securities received in exchange for or distributed on or with respect to securities described in (1) above, or pursuant to the exercise of options, warrants or rights relating to such securities. |
| (3) | Cash, cash items, government securities or high quality debt securities maturing in one year or less from the time of investment. |
As of March 31, 2017, 99.0% of our assets were qualifying assets.
Asset Coverage
Pursuant to Section 61(a)(2) of the 1940 Act, we are permitted, under specified conditions, to issue multiple classes of senior securities representing indebtedness. However, pursuant to Section 18(c) of the 1940 Act, we are permitted to issue only one class of senior securities that is stock. In either case, we may only issue such senior securities if such class of senior securities, after such issuance, has an asset coverage, as defined in Section 18(h) of the 1940 Act, of at least 200%.
In addition, our ability to pay dividends or distributions (other than dividends payable in our common stock) to holders of any class of our capital stock would be restricted if our senior securities representing indebtedness fail to have an asset coverage of at least 200% (measured at the time of declaration of such distribution and accounting for such distribution). The 1940 Act does not apply this limitation to privately arranged debt that is not intended to be publicly distributed, unless this limitation is specifically negotiated by the lender. In addition, our ability to pay dividends or distributions (other than dividends payable in our common stock) to our common stockholders would be restricted if our senior securities that are stock fail to have an asset coverage of at least 200% (measured at the time of declaration of such distribution and accounting for such distribution). If the value of our assets declines, we might be unable to satisfy these asset coverage requirements. To satisfy the 200% asset coverage requirement in the event that we are seeking to pay a distribution, we might either have to (i) liquidate a portion of our loan portfolio to repay a portion of our indebtedness or (ii) issue common stock. This may occur at a time when a sale of a portfolio asset may be disadvantageous, or when we have limited access to capital markets on agreeable terms. In addition, any amounts that we use to service our indebtedness or for offering costs will not be available for distributions to our stockholders. If we are unable to regain asset coverage through these methods, we may be forced to suspend the payment of such dividends or distributions.
16
Significant Managerial Assistance
A BDC generally must make available significant managerial assistance to issuers of certain of its portfolio securities that the BDC counts as a qualifying asset for the 70% test described above. Making available significant managerial assistance means, among other things, any arrangement whereby the BDC, through its directors, officers or employees, offers to provide, and, if accepted, does so provide, significant guidance and counsel concerning the management, operations or business objectives and policies of a portfolio company. Significant managerial assistance also includes the exercise of a controlling influence over the management and policies of the portfolio company. However, with respect to certain, but not all such securities, where the BDC purchases such securities in conjunction with one or more other persons acting together, one of the other persons in the group may make available such managerial assistance, or the BDC may exercise such control jointly.
Code of Ethics
We and all of the Gladstone family of companies, have adopted a code of ethics and business conduct applicable to all of the officers, directors and personnel of such companies that complies with the guidelines set forth in Item 406 of Regulation S-K of the Securities Act of 1933 (the “Securities Act”) and Rule 17j-1 of the 1940 Act. As required by the 1940 Act, this code establishes procedures for personal investments, restricts certain transactions by such personnel and requires the reporting of certain transactions and holdings by such personnel. This code of ethics and business conduct is publicly available on our website under “Investor Relations - Corporate Governance” at www.GladstoneInvestment.com. We intend to provide any required disclosure of any amendments to or waivers of the provisions of this code by posting information regarding any such amendment or waiver to our website or in a Current Report on Form 8-K.
Compliance Policies and Procedures
We and the Adviser have adopted and implemented written policies and procedures reasonably designed to prevent violation of the federal securities laws, and our Board of Directors is required to review these compliance policies and procedures annually to assess their adequacy and the effectiveness of their implementation. We have designated a chief compliance officer, John Dellafiora, Jr., who also serves as chief compliance officer for all of our Gladstone affiliates.
Staffing
We do not currently have any employees and do not expect to have any employees in the foreseeable future. Currently, services necessary for our business are provided by individuals who are employees of the Adviser and the Administrator pursuant to the terms of the Advisory Agreement and the Administration Agreement, respectively. No employee of the Adviser or the Administrator will dedicate all of his or her time to us. However, we expect that 20 to 25 full time employees of the Adviser and the Administrator will spend substantial time on our matters during the remainder of calendar year 2017 and all of calendar year 2018. To the extent we acquire more investments, we anticipate that the number of employees of the Adviser and the Administrator who devote time to our matters will increase.
As of May 8, 2017, the Adviser and Administrator collectively had 64 full-time employees. A breakdown of these employees is summarized by functional area in the table below:
| Number of |
Functional Area | |
| 12 | Executive management | |
| 16 | Accounting, administration, compliance, human resources, legal and treasury | |
| 36 | Investment management, portfolio management and due diligence |
Available Information
Copies of our annual report on Form 10-K, quarterly reports on Form 10-Q, current reports on Form 8-K, and amendments, if any, to those reports filed or furnished pursuant to Section 13(a) or 15(d) of the Securities Exchange Act of 1934, as amended (the “Exchange Act”) are available free of charge through our website at www.GladstoneInvestment.com as soon as reasonably practicable after such materials are electronically filed with or furnished to the SEC. A request for any of these reports may also be submitted to us by sending a written request addressed to Investor Relations, Gladstone Investment Corporation, 1521 Westbranch Drive, Suite 100, McLean, VA 22102, or by calling our toll-free investor relations line at 1-866-366-5745. The public may read and copy materials that we file with the SEC at the SEC’s Public Reference Room at 100 F Street, NE, Washington, DC 20549. Information on the operation of the Public Reference Room may be obtained by calling the SEC at 1-800-SEC-0330. The SEC also maintains a website that contains reports, proxy and information statements, and other information regarding issuers that file electronically with the SEC at www.sec.gov.
17
| ITEM 1A. | RISK FACTORS |
You should carefully consider these risk factors, together with all of the other information included in this Annual Report on Form 10-K and the other reports and documents filed by us with the SEC. The risks set out below are not the only risks we face. Additional risks and uncertainties not presently known to us, or not presently deemed material by us, may also impair our operations and performance. If any of the following events occur, our business, financial condition, results of operations and cash flows could be materially and adversely affected. In such case, our net asset value (“NAV”) and the trading price of our securities could decline, and you may lose all or part of your investment. The risk factors described below are the principal risk factors associated with an investment in our securities as well as those factors generally associated with an investment company with investment objectives, investment policies, capital structure or trading markets similar to ours.
Risks Related to Our Investments
We operate in a highly competitive market for investment opportunities.
A large number of entities compete with us to make the types of investments we seek to make in Lower Middle Market companies. We compete with public and private buyout funds, commercial and investment banks, commercial financing companies, and, to the extent that they provide an alternative form of financing, hedge funds, mutual funds, and private equity. Many of our competitors are substantially larger and have considerably greater financial, technical and marketing resources than we do. For example, some competitors may have a lower cost of funds and access to funding sources that are not available to us. In addition, some of our competitors may have higher risk tolerances or different risk assessments, which would allow them to consider a wider variety of investments and establish more relationships than us. Furthermore, many of our competitors are not subject to the regulatory restrictions that the 1940 Act imposes on us as a BDC. The competitive pressures we face could have a material adverse effect on our business, financial condition and results of operations. Also, as a result of this competition, we may not be able to take advantage of attractive investment opportunities from time to time and we can offer no assurance that we will be able to identify and make investments that are consistent with our investment objective. We do not seek to compete based on the interest rates we offer and we believe that some of our competitors may make loans with interest rates that will be comparable to or lower than the rates we offer. We may lose investment opportunities if we do not match our competitors’ pricing, terms, and structure. However, if we match our competitors’ pricing, terms, and structure, we may experience decreased net interest income and increased risk of credit loss.
Our investments in Lower Middle Market portfolio companies are extremely risky and could cause you to lose all or a part of your investment.
Investments in Lower Middle Market portfolio companies are subject to a number of significant risks including the following:
| • | Lower Middle Market businesses are likely to be more significantly impacted in economic downturns than larger businesses. Our portfolio companies may have fewer resources than larger businesses, and any economic downturns or recessions, are more likely to have a material adverse effect on them. If one of our portfolio companies is adversely impacted by a recession, its ability to repay our loan or engage in a liquidity event, such as a sale, recapitalization or initial public offering would be diminished. |
| • | Lower Middle Market businesses may have limited financial resources and may not be able to repay the loans we make to them. Our strategy includes providing financing to portfolio companies that typically do not have readily available access to financing. While we believe that this provides an attractive opportunity for us to generate profits, this may make it difficult for the portfolio companies to repay their loans to us upon maturity. A borrower’s ability to repay its loan may be adversely affected by numerous factors, including the failure to meet its business plan, a downturn in its industry or negative economic conditions. Deterioration in a borrower’s financial condition and prospects usually will be accompanied by deterioration in the value of any collateral and a reduction in the likelihood of realizing on any guaranties we may have obtained from the borrower’s management. As of March 31, 2017, certain loans to two portfolio companies were on non-accrual status with an aggregate debt cost basis of $15.6 million, or 4.1%, of the cost basis of all debt investments in our portfolio. While we are working with the portfolio companies to improve their profitability and cash flows, there can be no assurance that our efforts will prove successful. Although we will generally seek to be the secured first lien lender to a borrower, in some of our loans we expect to be subordinated to a senior lender and our security interest in any collateral would, accordingly, likely be second lien and subordinate to another lender’s security interest. |
18
| • | Lower Middle Market businesses typically have narrower product lines and smaller market shares than large businesses. Our target portfolio companies tend to be more vulnerable to competitors’ actions and market conditions, as well as general economic downturns. In addition, our portfolio companies may face intense competition, including competition from companies with greater financial resources, more extensive development, manufacturing, marketing and other capabilities and a larger number of qualified managerial and technical personnel. |
| • | There is generally little or no publicly available information about these businesses. Because we seek to invest in privately owned businesses, there is generally little or no publicly available operating and financial information about our potential portfolio companies. As a result, we rely on our officers, the Adviser and its employees, Gladstone Securities and consultants to perform due diligence investigations of these portfolio companies, their operations, and their prospects. We may not learn all of the material information we need to know regarding these businesses through our investigations to make a well informed investment decision. |
| • | Lower Middle Market businesses generally have less predictable operating results. We expect that our portfolio companies may have significant variations in their operating results, may from time to time be exposed to litigation, may be engaged in rapidly changing businesses with products subject to a substantial risk of obsolescence, may require substantial additional capital to support their operations, to finance expansion or to maintain their competitive position, may otherwise have a weak financial position or may be adversely affected by changes in the business cycle. Our portfolio companies may not meet net income, cash flow and other coverage tests typically imposed by their senior lenders. A borrower’s failure to satisfy financial or operating covenants imposed by senior lenders could lead to defaults and, potentially, foreclosure on its senior credit facility, which could additionally trigger cross-defaults in other agreements. If this were to occur, it is possible that the borrower’s ability to repay our loan would be jeopardized. |
| • | Lower Middle Market businesses are more likely to be dependent on one or two persons. Typically, the success of a Lower Middle Market business also depends on the management talents and efforts of one or two persons or a small group of persons. The death, disability or resignation of one or more of these persons could have a material adverse impact on our borrower and, in turn, on us. |
| • | Lower Middle Market businesses may have limited operating histories. While we intend to continue to target stable companies with proven track records, we may make loans to new companies that meet our other investment criteria. Portfolio companies with limited operating histories will be exposed to all of the operating risks that new businesses face and may be particularly susceptible to, among other risks, market downturns, competitive pressures and the departure of key executive officers. |
| • | Debt securities of Lower Middle Market companies typically are not rated by a credit rating agency. Typically, a Lower Middle Market business cannot or will not expend the resources to have their debt securities rated by a credit rating agency. We expect that most, if not all, of the debt securities we acquire will be unrated. Investors should assume that these loans would be at rates below what is today considered “investment grade” quality. Investments rated below investment grade are often referred to as high yield securities or junk bonds and may be considered high risk as compared to investment-grade debt instruments. |
Because the loans we make and equity securities we receive when we make loans are not publicly traded, there is uncertainty regarding the value of our privately held securities that could adversely affect our determination of our NAV.
Our portfolio investments are, and we expect will continue to be, in the form of securities that are not publicly traded. The fair value of securities and other investments that are not publicly traded may not be readily determinable. Our Board of Directors has ultimate responsibility for reviewing and approving, in good faith, the fair value of our investments, based on the Policy. Our Board of Directors reviews valuation recommendations that are provided by the Valuation Team. In valuing our investment portfolio, several techniques are used, including, but not limited to, a total enterprise value approach, a yield analysis, and market quotes. Currently, Standard & Poor’s Securities Evaluation, Inc. provides estimates of fair value on generally all of our debt investments and we use another independent valuation firm to provide valuation inputs for our significant equity investments, including earnings multiple ranges, as well as other information. In addition to these techniques, inputs and information, other factors are considered when determining fair value of our investments, including but not limited to: the nature and realizable value of the collateral, including external parties’ guaranties; any relevant offers or letters of intent to acquire the portfolio company; timing of expected loan repayments; and the markets in which the portfolio company operates. If applicable, new and follow-on debt and equity investments made during the current three month reporting period are generally valued at original cost basis. For additional information on our valuation policies, procedures and processes, see “Management’s Discussion and Analysis of Financial Condition and Results of Operations — Critical Accounting Policy — Investment Valuation.”
19
Fair value measurements of our investments may involve subjective judgments and estimates and, due to the uncertainty inherent in valuing these securities, the Adviser’s determination of fair value may fluctuate from period to period and may differ materially from the values that could be obtained if a ready market for these securities existed. Additionally, changes in the market environment and other events that may occur over the life of the investment may cause the gains or losses ultimately realized on these investments to be different than the valuations currently assigned.
The valuation process for certain of our portfolio holdings creates a conflict of interest.
A substantial portion of our portfolio investments are made in the form of securities that are not publicly traded. As a result, our Board of Directors determines the fair value of these securities in good faith pursuant the Policy. In connection with that determination, our Valuation Team prepares portfolio company valuations based upon the most recent portfolio company financial statements available and projected financial results of each portfolio company. The participation of our Adviser’s investment professionals in our valuation process and Mr. Gladstone’s pecuniary interest in our Adviser may result in a conflict of interest, as the management fees that we pay our Adviser are based on our gross assets, less uninvested cash or cash equivalents from borrowings.
The lack of liquidity of our privately held investments may adversely affect our business.
We will generally make investments in private companies whose securities are not traded in any public market. Substantially all of the investments we presently hold and the investments we expect to acquire in the future are, and will be, subject to legal and other restrictions on resale and will otherwise be less liquid than publicly-traded securities. The illiquidity of our investments may make it difficult for us to quickly obtain cash equal to the value at which we record our investments if the need arises. This could cause us to miss important investment opportunities. In addition, if we are required to liquidate all or a portion of our portfolio quickly, we may record substantial realized losses upon liquidation. We may also face other restrictions on our ability to liquidate an investment in a portfolio company to the extent that we, the Adviser, the Administrator, or our respective officers, or affiliates have material non-public information regarding such portfolio company.
Due to the uncertainty inherent in valuing these securities, the Adviser’s determinations of fair value may differ materially from the values that could be obtained if a ready market for these securities existed. Our NAV could be materially affected if the Adviser’s determinations regarding the fair value of our investments are materially different from the values that we ultimately realize upon our disposal of such securities.
Our financial results could be negatively affected if a significant portfolio investment fails to perform as expected.
Our total investment in one or more companies may be significant individually or in the aggregate. As a result, if a significant investment in one or more companies fails to perform as expected, our financial results could be more negatively affected and the magnitude of the loss could be more significant than if we had made smaller investments in more companies. Our five largest investments represented 27.4% of the fair value of our total portfolio as of March 31, 2017, compared to 30.5% as of March 31, 2016. Any disposition of a significant investment in one or more companies may negatively impact our net investment income and limit our ability to pay distributions.
The tightening of the U.S. monetary policy through the increase in the Federal Reserve System (“Fed”) interest rate has resulted in two interest rate raises by 25 basis points, respectively. The increase in the Fed rate can have a negative effect on our investments by making it harder and more expensive to refinance capital structures or even obtain financing.
In December 2016, the Fed again raised the fed funds rate by 0.25%, with additional gradual increases expected to come over the next year. As interest rates increase, generally, the cost of borrowing increases, affecting our ability to make new investments on favorable terms or at all. More generally, interest rate fluctuations and changes in credit spreads on floating rate loans may have a negative impact on our investments and investment opportunities and, accordingly, may have a material adverse effect on our rate of return on invested capital, our net investment income, our net asset value and the market price of our securities. A substantial portion of our debt investments have variable interest rates that reset periodically and are generally based on LIBOR, so an increase in interest rates from the current interest rate may make it more difficult for our portfolio companies to service their obligations under the debt investments that we hold. To the extent that interest rates increase, this may negatively impact the operating performance of our portfolio companies due to increasing debt service obligations and, therefore, may affect our results of operations. In addition, to the extent that an increase in interest rates makes it difficult or impossible to make payments on outstanding indebtedness to us or other financial sponsors or refinance debt that is maturing in the near term, some of our portfolio companies may be unable to repay such debt at maturity and may be forced to sell assets, undergo a recapitalization or seek bankruptcy protection. There can be no guaranty the Fed will raise rates at the gradual pace they originally proposed, nor can there be any assurance that the Fed will make sound decisions as to when to raise rates. The increase in interest rates could have a negative effect on our investments.
20
We generally will not be involved in the day-to-day operations and decision making of our portfolio companies.
We generally are not, and do not expect to be, involved in the day-to-day operations and decision making of our portfolio companies, even though we may have board representation or board observation rights and our debt agreements may contain certain restrictive covenants. As a result, we are subject to the risk that a portfolio company in which we invest may make business decisions with which we disagree and the management of such company, as representatives of the holders of their common stock, may take risks or otherwise act in ways that do not serve our interests of maximizing our investment value.
We typically invest in transactions involving acquisitions, buyouts and recapitalizations of companies, which will subject us to the risks associated with change in control transactions.
Our strategy, in part, includes making debt and equity investments in companies in connection with acquisitions, buyouts and recapitalizations, which subjects us to the risks associated with change in control transactions. Change in control transactions often present a number of uncertainties. Companies undergoing change in control transactions often face challenges retaining key employees and maintaining relationships with customers and suppliers. While we hope to avoid many of these difficulties by participating in transactions where the management team is retained and by conducting thorough due diligence in advance of our decision to invest, if our portfolio companies experience one or more of these problems, we may not realize the value that we expect in connection with our investments, which would likely harm our operating results and financial condition.
Our portfolio companies may incur debt that ranks equally with, or senior to, our investments in such companies.
We primarily invest in secured first and second lien debt securities issued by our portfolio companies. In some cases, portfolio companies will be permitted to have other debt that ranks equally with, or senior to, the debt securities in which we invest. By their terms, such debt securities may provide that the holders thereof are entitled to receive payment of interest and principal on or before the dates on which we are entitled to receive payments in respect of the debt securities in which we invest. Also, in the event of insolvency, liquidation, dissolution, reorganization, or bankruptcy of a portfolio company, holders of debt instruments ranking senior to our investment in that portfolio company would typically be entitled to receive payment in full before we receive any distribution in respect of our investment. After repaying such senior creditors, such portfolio company may not have any remaining assets to use for repaying its obligation to us. In the case of debt ranking equally with debt securities in which we invest, we would have to share on an equal basis any distributions with other creditors holding such debt in the event of an insolvency, liquidation, dissolution, reorganization, or bankruptcy of a portfolio company.
Prepayments of our investments by our portfolio companies could adversely impact our results of operations and reduce our return on investment.
In addition to risks associated with delays in investing our capital, to a lesser extent, we are also subject to the risk that investments we make in our portfolio companies may be repaid prior to maturity. During the fiscal year 2017, we experienced prepayments of term debt investments of $30.5 million. We will first use any proceeds from prepayments to repay any borrowings outstanding on the Credit Facility. In the event that funds remain after repayment of our outstanding borrowings, then we may reinvest these proceeds in government securities, pending their future investment in new debt and/or equity securities. These government securities will typically have substantially lower yields than the debt securities being prepaid and we could experience significant delays in reinvesting these amounts. As a result, our results of operations could be materially adversely affected if one or more of our portfolio companies elect to prepay amounts owed to us. While we generally do not provide for prepayments of our debt investments where we also own a significant equity investment in a portfolio company, prepayments allowable under pure debt investments could negatively impact our return on those investments, which could result in a decline in the market price of our common stock.
Our portfolio is concentrated in a limited number of companies and industries, which subjects us to an increased risk of significant loss if any one of these companies does not repay us or if the industries experience downturns.
As of March 31, 2017, we had investments in 35 portfolio companies, the five largest of which included JR Hobbs, Counsel Press, Cambridge, Nth Degree, and Drew Foam, and comprised $137.5 million, or 27.4%, of our total investment portfolio, at fair value. A consequence of a limited number of investments is that the aggregate returns we realize may be substantially adversely affected by the unfavorable performance of a small number of such loans or a substantial write-down of any one investment. Beyond our regulatory and income tax diversification requirements, as well as the Credit Facility requirements, we do not have fixed guidelines for industry concentration and our investments could potentially be concentrated in relatively few industries. In addition, while we do not intend to invest 25% or more of our total assets in a particular industry or group of industries at the time of investment, it is possible that as the values of our portfolio companies change, one industry or a group of industries may comprise in excess of 25% of the value of our total assets. A downturn in a particular industry in which we have invested a significant portion of our total assets could have a materially adverse effect on us. As of March 31, 2017, our largest industry concentration was in Home and Office Furnishings, Housewares, and Durable Consumer Products, representing 18.6% of our total investments, at fair value.
21
Our investments are typically long term and will require several years to realize liquidation events.
Since we generally make five to seven year term loans and hold our loans and related equity positions until the loans mature, investors should not expect realization events, if any, to occur over the near term. In addition, we expect that any equity investments may require several years to appreciate in value and we cannot give any assurance that such appreciation will occur.
The disposition of our investments may result in contingent liabilities.
Currently, all but one of our investments involve private securities. In connection with the disposition of an investment in private securities, we may be required to make representations about the business and financial affairs of the underlying portfolio company typical of those made in connection with the sale of a business. We may also be required to indemnify the purchasers of such investment to the extent that any such representations turn out to be inaccurate or with respect to certain potential liabilities. These arrangements may result in contingent liabilities that ultimately yield funding obligations that must be satisfied through our return of certain distributions previously made to us.
There may be circumstances where our debt investments could be subordinated to claims of other creditors or we could be subject to lender liability claims.
Even though we have structured most of our investments as secured first and second lien loans, if one of our portfolio companies were to go bankrupt, depending on the facts and circumstances, including the extent to which we actually provided managerial assistance to that portfolio company, a bankruptcy court might re-characterize our debt investments and subordinate all, or a portion, of our claims to that of other creditors. Holders of debt instruments ranking senior to our investments typically would be entitled to receive payment in full before we receive any payments. After repaying such senior creditors, such portfolio company may not have any remaining assets to use to repay its obligation to us. We may also be subject to lender liability claims for actions taken by us with respect to a borrower’s business or in instances in which we exercised control over the borrower. It is possible that we could become subject to a lender’s liability claim, including as a result of actions taken in rendering significant managerial assistance.
Portfolio company-related litigation could result in costs, including defense costs or damages, and the diversion of management time and resources.
In the course of investing in and often providing significant managerial assistance to certain of our portfolio companies, certain persons employed by the Adviser sometimes serve as directors on the boards of such companies. To the extent that litigation arises out of our investments in these companies, even if meritless, we or such employees may be named as defendants in such litigation, which could result in additional costs, including defense costs, and the diversion of management time and resources. We may be unable to accurately estimate our exposure to litigation risk if we record balance sheet reserves for probable loss contingencies. As a result, any reserves we establish to cover any settlements or judgments may not be sufficient to cover our actual financial exposure, which may have a material impact on our results of operations, financial condition, or cash flows.
In view of the inherent difficulty of predicting the outcome of legal actions and regulatory matters, we cannot provide assurance as to the outcome of any threatened or pending matter or, if resolved adversely, the costs associated with any such matter, particularly where the claimant seeks very large or indeterminate damages or where the matter presents novel legal theories, involves a large number of parties or is at a preliminary stage. The resolution of any such matters may be time consuming, expensive, and may distract management from the conduct of our business. The resolution of certain threatened or pending legal actions or regulatory matters, if unfavorable, whether in settlement or a judgment, could have a material adverse effect on our financial condition, results of operations, or cash flows for the quarter in which such actions or matters are resolved or a reserve is established.
For example, a former portfolio company, Noble Logistics, Inc. (“Noble”) is a defendant in employment law wage and hour and independent contractor misclassification claims in a purported class action seeking monetary damages, Maximo v. Aspen Contracting California LLC d/b/a/ Noble Logistics, et al., or Maximo. Noble is a debtor in a bankruptcy case under Chapter 11 of the federal bankruptcy code, pending in federal bankruptcy court in Delaware. The claims against Noble asserted in the Maximo case have been stayed by the filing of Noble’s bankruptcy case. A lawsuit brought by plaintiffs Clarence and Sheila Walder against a customer of Noble is also pending in California based on similar facts relating to Noble and claims under California law. The Maximo and Walder plaintiffs have attempted to bring claims against the Company and other former investors in Noble based primarily on allegations that the Company and other investors controlled Noble and were responsible for the misclassification of Noble’s workforce. To date, claims against the Company have been struck by a court or voluntarily dismissed by the plaintiffs in connection with the automatic
22
stay arising in connection with the Noble bankruptcy. While neither the Company nor any of its portfolio companies (other than Noble) are currently defendants in these cases, they may in the future be subject to claims by these plaintiffs or other persons alleging similar claims, or may expend funds on behalf of Noble to defend claims.
While the Company believes it would have valid defenses to potential claims brought due to our investment in any portfolio company, and will defend any such claims vigorously, it may nevertheless expend significant amounts of money in defense costs and expenses. Further, if the Company enters into settlements or suffers an adverse outcome in any litigation, the Company could be required to pay significant amounts. In addition, if any of the Company’s portfolio companies become subject to direct or indirect claims or other obligations, such as defense costs or damages in litigation or settlement, the Company’s investment in such companies could diminish in value and the Company could suffer indirect losses. Further, these matters could cause the Company to expend significant management time and effort in connection with assessment and defense of any claims. No range of potential expenses, costs or damages in connection with these matters can be estimated at this time.
We may not realize gains from our equity investments and other yield enhancements.
We generally make equity investments in combination with secured debt investments. We may also receive other equity interests to purchase stock issued by the portfolio company, such as warrants, and will generally receive other yield enhancements, such as success fees. Our goal is to ultimately dispose of these equity interests and realize gains and collect the yield enhancements. We expect that, over time, the realized gains from the disposition of equity interests and the yield enhancements we collect will offset any losses we may experience on potential loan defaults. However, equity interests may not appreciate in value and, in fact, may decline in value and any other yield enhancements, such as success fees, may not be collected. Accordingly, we may not be able to realize gains from our equity interests or collect other yield enhancements and any gains we do recognize and yield enhancements we collect may not be sufficient to offset losses we experience on other debt and equity investments.
During the fiscal years ended March 31, 2017, we recorded a net realized gain on investments of $15.6 million. During the fiscal years ended 2016 and 2015, we recorded net realized losses on investments of $4.6 million and $0.1 million, respectively. There can be no guaranties that such net realized gains can be achieved in future periods and the impact of such sales on our results of operations in prior periods should not be relied upon as being indicative of performance in future periods. For the years ended March 31, 2017, 2016 and 2015, success fee income totaled $2.4 million, $1.6 million and $1.4 million, respectively.
Any cumulative unrealized depreciation we experience on our investment portfolio may be an indication of future realized losses, which could reduce any gains available for distribution.
As a BDC we are required to carry our investments at market value or, if no market value is ascertainable, at fair value as determined in good faith by or under the direction of our Board of Directors. We will record decreases in the market values or fair values of our investments as unrealized depreciation. Since our inception, we have, at times, incurred a cumulative net unrealized depreciation of our portfolio. Any unrealized depreciation in our investment portfolio could result in realized losses in the future and ultimately in reductions of any gains available for distribution to stockholders in future periods.
The recent volatility of oil and natural gas prices could impair certain of our portfolio companies’ operations and ability to satisfy obligations to their respective lenders and investors, including us, which could negatively impact our financial condition.
Certain of our portfolio companies’ businesses may be impacted by the prices of, and demand for, oil and natural gas, which have recently declined significantly and such volatility could continue or increase in the future. A substantial or extended decline in oil and natural gas demand or prices may adversely affect the business, financial condition, cash flow, liquidity or results of operations of these portfolio companies and might impair their ability to meet capital expenditure obligations and financial commitments. A prolonged or continued decline in oil prices could therefore have an adverse effect on our business, financial condition and results of operations.
23
Risks Related to Our External Financing
In addition to regulatory limitations on our ability to raise capital, the Credit Facility contains various covenants which, if not complied with, could accelerate our repayment obligations under the facility, thereby materially and adversely affecting our liquidity, financial condition, results of operations and ability to pay distributions.
We will have a continuing need for capital to finance our investments. As of March 31, 2017, we, through our wholly-owned subsidiary, Business
Investment, had $69.7 million in borrowings, at cost, outstanding under the Credit Facility, which provides for maximum borrowings of $165.0 million, with a revolving period end date of November 15, 2019 (the “Revolving Period
End Date”). The Credit Facility permits us to fund additional loans and investments as long as we are within the conditions and covenants set forth in the credit agreement. Among other things, the Credit Facility contains covenants that require
Business Investment to maintain its status as a separate legal entity, prohibit certain significant corporate transactions (such as mergers, consolidations, liquidations or dissolutions) and restrict certain material changes to our credit and
collection policy without the lenders’ consent. The Credit Facility also generally seeks to restrict distributions to shareholders to the sum of (i) our net investment income, (ii) net capital gains, and (iii) amounts deemed by
the Company to be considered as having been paid during the prior fiscal year in accordance with
Section 855(a) of the Code. Loans eligible to be pledged as collateral are subject to certain limitations, including, among other things,
restrictions on geographic concentrations, industry concentrations, loan size, payment frequency and status, average life, portfolio company leverage, and lien property. The Credit Facility also requires Business Investment to comply with other
financial and operational covenants, which obligate Business Investment to, among other things, maintain certain financial ratios, including asset and interest coverage and a minimum number of obligors required in the borrowing base. Additionally,
the Credit Facility contains a performance guaranty that requires the Company to maintain (i) a minimum net worth (defined in the Credit Facility to include our mandatory redeemable term preferred stock) of the greater of $210.0 million or
$210.0 million plus 50% of all equity and subordinated debt raised minus 50% of any equity or subordinated debt redeemed or retired after November 16, 2016, which equates to $210.0 million as of March 31, 2017, (ii) asset
coverage with respect to senior securities representing indebtedness of at least 200%, in accordance with Sections 18 and 61 of the 1940 Act and (iii) our status as a BDC under the 1940 Act and as a RIC under the Code. As of March 31,
2017, and as defined in the performance guaranty of the Credit Facility, we had a net worth of $434.3 million, an asset coverage ratio on our senior securities representing indebtedness of 661.3%, calculated in compliance with the requirements
of Sections 18 and 61 of the 1940 Act, and an active status as a BDC and RIC. As of March 31, 2017, we were in compliance with all covenants under the Credit Facility; however, our continued compliance depends on many factors, some of
which are beyond our control.
Given the continued uncertainty in the capital markets, the cumulative net unrealized depreciation in our portfolio may increase in future periods and threaten our ability to comply with the minimum net worth covenant and other covenants under the Credit Facility. Our failure to satisfy these covenants could result in foreclosure by our lenders, which would accelerate our repayment obligations under the facility and thereby have a material adverse effect on our business, liquidity, financial condition, results of operations and ability to pay distributions to our stockholders.
Any inability to renew, extend or replace the Credit Facility on terms favorable to us, or at all, could adversely impact our liquidity and ability to fund new investments or maintain distributions to our stockholders.
If the Credit Facility is not renewed or extended by the Revolving Period End Date, all principal and interest will be due and payable on or before November 15, 2021 (two years after the Revolving Period End Date). Subject to certain terms and conditions, the Credit Facility may be expanded to a total of $250 million through additional commitments of existing or new lenders. However, if such lenders are unwilling to provide additional commitments under the terms of the Credit Facility, we will be unable to expand the Credit Facility and thus will continue to have limited availability to finance new investments under the Credit Facility. There can be no guaranty that we will be able to renew, extend or replace the Credit Facility upon its Revolving Period End Date on terms that are favorable to us, if at all. Our ability to expand the Credit Facility, and to obtain replacement financing at or before the time of its Revolving Period End Date, will be constrained by then-current economic conditions affecting the credit markets. In the event that we are not able to expand the Credit Facility, or to renew, extend or refinance the Credit Facility by the Revolving Period End Date, this could have a material adverse effect on our liquidity and ability to fund new investments, our ability to make distributions to our stockholders and our ability to qualify as a RIC under the Code.
If we are unable to secure replacement financing, we may be forced to sell certain assets on disadvantageous terms, which may result in realized losses, and such realized losses could materially exceed the amount of any unrealized depreciation on these assets as of our most recent balance sheet date, which would have a material adverse effect on our results of operations. Such circumstances would also increase the likelihood that we would be required to redeem some or all of our outstanding mandatorily redeemable preferred stock, which could potentially require us to sell more assets. In addition to selling assets, or as an alternative, we may issue common equity in order to repay amounts outstanding under the Credit Facility. Based on the recent trading prices of our common stock, such an equity offering may have a substantial dilutive impact on our existing stockholders’ interest in our earnings, assets and voting interest in us. If we are able to renew, extend or refinance the Credit Facility prior to maturity, renewal, extension or refinancing, it could potentially result in significantly higher interest rates and related charges and may impose significant restrictions on the use of borrowed funds to fund investments or maintain distributions to common and preferred stockholders.
24
Because we expect to distribute substantially all of our Investment Company Taxable Income, at least 90%, on an annual basis, our business plan is dependent upon external financing, which is constrained by the limitations of the 1940 Act.
We completed recent equity offerings of our Series D Term Preferred Stock, Series C Term Preferred Stock and Series B Term Preferred Stock in September 2016, May 2015 and November 2014, respectively, and a common stock offering in March 2015, and there can be no assurance that we will be able to raise capital through issuing equity in the near future. Our business requires a substantial amount of cash to operate and grow. We may acquire such additional capital from the following sources:
| • | Senior Securities: We may issue senior securities representing indebtedness (including borrowings under the Credit Facility) and senior securities that are stock (including our Series B Term Preferred Stock, Series C Term Preferred Stock, and Series D Term Preferred Stock), up to the maximum amount permitted by the 1940 Act. The 1940 Act currently permits us, as a BDC, to issue senior securities representing indebtedness and senior securities which are stock, in amounts such that our asset coverage, as defined in Section 18(h) of the 1940 Act, is at least 200% on each such senior security immediately after each issuance of each such senior security. As a result of incurring indebtedness (in whatever form), we will be exposed to the risks associated with leverage. Although borrowing money for investments increases the potential for gain, it also increases the risk of a loss. A decrease in the value of our investments will have a greater impact on the value of our common stock to the extent that we have borrowed money to make investments. There is a possibility that the costs of borrowing could exceed the income we receive on the investments we make with such borrowed funds. In addition, our ability to pay distributions, issue senior securities or repurchase shares of our common stock would be restricted if the asset coverage on each of our senior securities is not at least 200%. If the aggregate fair value of our assets declines, we might be unable to satisfy that 200% requirement. To satisfy the 200% asset coverage requirement in the event that we are seeking to pay a distribution, we might either have to (i) liquidate a portion of our loan portfolio to repay a portion of our indebtedness or (ii) issue common stock. This may occur at a time when a sale of a portfolio asset may be disadvantageous, or when we have limited access to capital markets on agreeable terms. In addition, any amounts that we use to service our indebtedness or for offering costs will not be available for distributions to stockholders. Furthermore, if we have to issue common stock below NAV per common share, any non-participating stockholders will be subject to dilution, as described below. Pursuant to Section 61(a)(2) of the 1940 Act, we are permitted, under specified conditions, to issue multiple classes of senior securities representing indebtedness. However, pursuant to Section 18(c) of the 1940 Act, we are permitted to issue only one class of senior securities that are stock. |
| • | Common and Convertible Preferred Stock: Because we are constrained in our ability to issue debt or senior securities for the reasons given above, we are dependent on the issuance of equity as a financing source. If we raise additional funds by issuing more common stock, the percentage ownership of our common stockholders at the time of the issuance would decrease and our existing common stockholders may experience dilution. In addition, under the 1940 Act, we will generally not be able to issue additional shares of our common stock at a price below NAV per common share to purchasers, other than to our existing common stockholders through a rights offering, without first obtaining the approval of our stockholders and our independent directors. If we were to sell shares of our common stock below our then current NAV per common share, as we did in March 2015 and October 2012, such sales would result in an immediate dilution to the NAV per common share. This dilution would occur as a result of the sale of common shares at a price below the then current NAV per share of our common stock and a proportionately greater decrease in a common stockholder’s interest in our earnings and assets and voting percentage than the increase in our assets resulting from such issuance. For example, if we issue and sell an additional 10% of our common stock at a 5% discount from NAV, a common stockholder who does not participate in that offering for its proportionate interest will suffer NAV dilution of up to 0.5% or $5 per $1,000 of NAV. This imposes constraints on our ability to raise capital when our common stock is trading below NAV per common share, as it generally has for the last several years. As noted above, the 1940 Act prohibits the issuance of multiple classes of senior securities that are stock. As a result, we would be prohibited from issuing convertible preferred stock to the extent that such a security was deemed to be a separate class of stock from our outstanding mandatorily redeemable preferred stock. |
25
We financed certain of our investments with borrowed money and capital from the issuance of senior securities, which will magnify the potential for gain or loss on amounts invested and may increase the risk of investing in us.
The following table illustrates the effect of leverage on returns from an investment in our common stock assuming various annual returns on our portfolio, net of expenses. The calculations in the table below are hypothetical and actual returns may be higher or lower than those appearing in the table below.
| Assumed Return on Our Portfolio (Net of Expenses) |
||||||||||||||||||||
| (10 | )% | (5 | )% | 0 | % | 5 | % | 10 | % | |||||||||||
|
|
|
|
|
|
|
|
|
|
|
|||||||||||
| Corresponding return to common stockholder(A) |
(21.2 | )% | (12.6 | )% | (4.1 | )% | 4.5 | % | 13.0 | % | ||||||||||
| (A) | The hypothetical return to common stockholders is calculated by multiplying our total assets as of March 31, 2017, by the assumed rates of return and subtracting all interest on our debt and dividends on our mandatorily redeemable preferred stock expected to be paid or declared during the twelve months following March 31, 2017; and then dividing the resulting difference by our total net assets attributable to common stock as of March 31, 2017. Based on $515.2 million in total assets, $69.7 million in borrowings outstanding on the Credit Facility, $5.1 million in a secured borrowing, $41.4 million in aggregate liquidation preference of Series B Term Preferred Stock, $40.3 million in aggregate liquidation preference of Series C Term Preferred Stock, $57.5 million in aggregate liquidation preference of Series D Term Preferred Stock and $301.1 million in net assets as of March 31, 2017. |
Based on an aggregate outstanding indebtedness of $74.8 million at principal as of March 31, 2017, the effective annual interest rate of 4.3% as of that date, and aggregate liquidation preference of our mandatorily redeemable preferred stock of $139.2 million, our investment portfolio at fair value would have to produce an annual return of at least 2.4% to cover annual interest payments on the outstanding debt and dividends on our mandatorily redeemable preferred stock.
A change in interest rates may adversely affect our profitability and hedging arrangements may expose us to additional risks.
We anticipate using a combination of equity and long-term and short-term borrowings to finance our investment activities. As a result, a portion of our income will depend upon the spread between the rate at which we borrow funds and the rate at which we loan these funds. An increase or decrease in interest rates could reduce the spread between the rate at which we invest and the rate at which we borrow, and thus, adversely affect our profitability, if we have not appropriately hedged against such event. Alternatively, interest rate hedging arrangements may limit our ability to participate in the benefits of lower interest rates with respect to the hedged portfolio.
Ultimately, we expect approximately 90.0% of the loans in our portfolio to be at variable rates determined on the basis of the LIBOR and approximately 10.0% to be at fixed rates. As of March 31, 2017, based on the total principal balance of debt investments outstanding, our portfolio consisted of 92.9% of loans at variable rates with floors and 7.1% at fixed rates.
As of March 31, 2017, we did not have any hedging arrangement, such as interest rate hedges. While hedging arrangements may insulate us against adverse fluctuations in interest rates, they may also limit our ability to participate in the benefits of lower interest rates with respect to the hedged portfolio. Adverse developments resulting from changes in interest rates or any future hedging transactions could have a material adverse effect on our business, financial condition, results of operations, and cash flows. Our ability to receive payments pursuant to a hedging arrangement is linked to the ability of the counter-party to that hedging arrangement to make the required payments. To the extent that the counter-party to the hedging arrangement is unable to pay pursuant to the terms of the agreement, we may lose the hedging protection of the arrangement.
Also, the fair value of certain of our debt investments is based, in part, on the current market yields or interest rates of similar securities. A change in interest rates could have a significant impact on our determination of the fair value of these debt investments. In addition, a change in interest rates could also have an impact on the fair value of any hedging arrangements then in effect that could result in the recording of unrealized appreciation or depreciation in future periods. Therefore, adverse developments resulting from changes in interest rates could have a material adverse effect on our business, financial condition, results of operations, and cash flows. For additional information on interest rate fluctuations, see “Quantitative and Qualitative Disclosures About Market Risk.”
26
Risks Related to Our Regulation and Structure
We will be subject to corporate-level tax if we are unable to satisfy Code requirements for RIC qualification.
To maintain our qualification as a RIC, we must maintain our status as a BDC and meet annual distribution, income source, and asset diversification requirements. The annual distribution requirement is satisfied if we distribute at least 90% of our Investment Company Taxable Income to our stockholders on an annual basis. Because we use leverage, we are subject to certain asset coverage ratio requirements under the 1940 Act and could, under certain circumstances, be restricted from making distributions necessary to qualify as a RIC. Warrants we may receive with respect to debt investments will create original issue discount (“OID”), which we must recognize as ordinary income over the term of the debt investment. Similarly, PIK interest which is accrued generally over the term of the debt investment but not paid in cash, is recognized as ordinary income. Both OID and PIK interest will increase the amounts we are required to distribute to maintain our RIC status. Because such OIDs and PIK interest will not produce distributable cash for us at the same time as we are required to make distributions, we will need to use cash from other sources to satisfy such distribution requirements. As of March 31, 2017, we did not have investments with OID or a PIK feature. Additionally, we must meet asset diversification and income source requirements at the end of each calendar quarter. If we fail to meet these tests, we may need to quickly dispose of certain investments to prevent the loss of RIC status. Since most of our investments will be illiquid, such dispositions, if even possible, may not be made at prices advantageous to us and, in fact, may result in substantial losses. If we fail to qualify as a RIC as of a calendar quarter or annually for any reason and become fully subject to corporate income tax, the resulting corporate taxes could substantially reduce our net assets, the amount of income available for distribution, and the actual amount distributed. Such a failure would have a material adverse effect on us and our common stock. For additional information regarding asset coverage ratio and RIC requirements, see “Business — Material U.S. Federal Income Tax Considerations — RIC Status.”
Some of our debt investments may include success fees that would generally generate payments to us upon a change of control. Because the satisfaction of these success fees, and the ultimate payment of these fees, is uncertain and highly contingent, we generally only recognize them as income when the payment is received. Success fee amounts are characterized as ordinary income for tax purposes and, as a result, we are required to distribute such amounts to our stockholders in order to maintain our RIC status.
If we do not invest a sufficient portion of our assets in “qualifying assets,” we could fail to qualify as a BDC under the 1940 Act or be precluded from investing according to our current business strategy.
As a BDC, we may not acquire any assets other than “qualifying assets” unless, at the time of and after giving effect to such acquisition, at least 70% of our total assets are qualifying assets, as defined in Section 55(a) of the 1940 Act.
We believe that most of the investments that we may acquire in the future will constitute qualifying assets. However, we may be precluded from investing in what we believe to be attractive investments if such investments are not qualifying assets for purposes of the 1940 Act. If we do not invest a sufficient portion of our assets in qualifying assets, we could violate the 1940 Act provisions applicable to BDCs. As a result of such violation, specific rules under the 1940 Act could prevent us, for example, from making follow-on investments in existing portfolio companies (which could result in the dilution of our position) or could require us to dispose of investments at inappropriate times in order to come into compliance with the 1940 Act. If we need to dispose of such investments quickly, it could be difficult to dispose of such investments on favorable terms. We may not be able to find a buyer for such investments and, even if we do find a buyer, we may have to sell the investments at a substantial loss. Any such outcomes would have a material adverse effect on our business, financial condition, results of operations and cash flows.
If we do not maintain our status as a BDC, we would be subject to regulation as a registered closed-end investment company under the 1940 Act. As a registered closed-end investment company, we would be subject to substantially more regulatory restrictions under the 1940 Act, which would significantly decrease our operating flexibility. For additional information regarding qualifying assets, see “Business — Regulation as a BDC — Qualifying Assets.”
Changes in laws or regulations governing our operations, or changes in the interpretation thereof, and any failure by us to comply with laws or regulations governing our operations may adversely affect our business.
We, and our portfolio companies, are subject to regulation by laws at the local, state and federal levels. These laws and regulations, as well as their interpretation, may be changed from time to time. Accordingly, any change in these laws or regulations, or their interpretation, or any failure by us or our portfolio companies to comply with these laws or regulations may adversely affect our business. For additional information regarding the regulations to which we are subject, see “Business — Material U.S. Federal Income Tax Considerations — RIC Status” and “Business — Regulation as a BDC.”
27
Provisions of the Delaware General Corporation Law and of our certificate of incorporation and bylaws could restrict a change in control and have an adverse impact on the price of our common stock.
We are subject to provisions of the Delaware General Corporation Law that, in general, prohibit any business combination with a beneficial owner of 15% or more of our common stock for three years unless the holder’s acquisition of our stock was either approved in advance by our Board of Directors or ratified by our Board of Directors and stockholders owning two-thirds of our outstanding stock not owned by the acquiring holder. Although we believe these provisions collectively provide for an opportunity to receive higher bids by requiring potential acquirers to negotiate with our Board of Directors, they would apply even if the offer may be considered beneficial by some stockholders.
We have also adopted other measures that may make it difficult for a third party to obtain control of us, including provisions of our certificate of incorporation classifying our Board of Directors in three classes serving staggered three-year terms, and provisions of our certificate of incorporation authorizing our Board of Directors to induce the issuance of additional shares of our stock. These provisions, as well as other provisions of our certificate of incorporation and bylaws, may delay, defer, or prevent a transaction or a change in control that might otherwise be in the best interests of our stockholders.
We may not be permitted to declare a dividend or make any distribution to stockholders or repurchase shares until such time as we satisfy the asset coverage tests under the provisions of the 1940 Act that apply to BDCs. As a BDC, we have the ability to issue senior securities only in amounts such that our asset coverage, as defined in the 1940 Act, equals at least 200% after each issuance of senior securities. If the value of our assets declines, we may be unable to satisfy this test. If that happens, we may be required to sell a portion of our investments and, depending on the nature of our leverage, repay a portion of our debt at a time when such sales and/or repayments may be disadvantageous.
Regulations governing our operation as a BDC and RIC will affect our ability to raise, and the way in which we raise, additional capital or borrow for investment purposes, which may have a negative effect on our growth. As a result of the annual distribution requirement to qualify as a RIC, we may need to periodically access the capital markets to raise cash to fund new investments. We may issue senior securities representing indebtedness, including borrowing money from banks or other financial institutions, or senior securities that are stock, such as our Series B Term Preferred Stock, our Series C Term Preferred Stock, and our Series D Term Preferred Stock, only in amounts such that our asset coverage, as defined in the 1940 Act, equals at least 200% after each such incurrence or issuance. Further, we may not be permitted to declare a dividend or make any distribution to our outstanding stockholders or repurchase shares until such time as we satisfy this test. Our ability to issue different types of securities is also limited. Compliance with these requirements may unfavorably limit our investment opportunities and reduce our ability in comparison to other companies to profit from favorable spreads between the rates at which we can borrow and the rates at which we can lend. As a BDC, therefore, we intend to continuously issue equity at a rate more frequent than our privately owned competitors, which may lead to greater stockholder dilution. We have incurred leverage to generate capital to make additional investments. If the value of our assets declines, we may be unable to satisfy the asset coverage test under the 1940 Act, which could prohibit us from paying distributions and could prevent us from qualifying as a RIC. If we cannot satisfy the asset coverage test, we may be required to sell a portion of our investments and, depending on the nature of our debt financing, repay a portion of our indebtedness at a time when such sales and repayments may be disadvantageous.
The current U.S. presidential administration (the “Administration”) may make substantial changes to certain regulations that may adversely affect our business.
The Administration has called for substantial change to fiscal and tax policies, which may include comprehensive tax reform, including significant changes to taxation of business entities and the deductibility of interest expense. On February 3, 2017, President Trump signed an executive order calling for the Administration to review U.S. financial laws and regulations in order to determine their consistency with a set of core principles identified in the order. Some areas identified as subject to potential change, amendment or repeal include the Dodd-Frank Act, the Consumer Protection Act, the Volcker Rule, credit risk retention requirements and the authorities of the Fed and the Financial Stability Oversight Council. We cannot predict which, if any, of these or other actions will be taken or, if taken, their effect on the financial stability of the credit market in which we operate. Such actions could have a significant adverse effect on our business, financial condition, results of operations, and cash flows.
Risks Related to Our External Management
We are dependent upon our key management personnel and the key management personnel of the Adviser, particularly David Gladstone, Terry Lee Brubaker and David Dullum, and on the continued operations of the Adviser, for our future success.
We have no employees. Our chief executive officer, chief operating officer, chief financial officer and treasurer, chief valuation officer, and the employees of the Adviser, do not spend all of their time managing our activities and our investment portfolio. We are
28
particularly dependent upon David Gladstone, Terry Lee Brubaker and David Dullum for their experience, skills, and networks. Our executive officers and the employees of the Adviser allocate some, and in some cases a material portion, of their time to businesses and activities that are not related to our business. We have no separate facilities and are completely reliant on the Adviser, which has significant discretion as to the implementation and execution of our business strategies and risk management practices. We are subject to the risk of discontinuation of the Adviser’s operations or termination of the Advisory Agreement and the risk that, upon such event, no suitable replacement will be found. We believe that our success depends to a significant extent upon the Adviser and that discontinuation of its operations or the loss of its key management personnel could have a material adverse effect on our ability to achieve our investment objectives.
Our success depends on the Adviser’s ability to attract and retain qualified personnel in a competitive environment.
The Adviser experiences competition in attracting and retaining qualified personnel, particularly investment professionals and senior executives, and we may be unable to maintain or grow our business if we cannot attract and retain such personnel. The Adviser’s ability to attract and retain personnel with the requisite credentials, experience and skills depends on several factors including, but not limited to, its ability to offer competitive wages, benefits and professional growth opportunities. The Adviser competes with investment funds (such as private equity funds and mezzanine funds) and traditional financial services companies for qualified personnel, many of which have greater resources than us. Searches for qualified personnel may divert management’s time from the operation of our business. Strain on the existing personnel resources of the Adviser, in the event that it is unable to attract experienced investment professionals and senior executives, could have a material adverse effect on our business.
We are dependent upon the contacts and relationships of the Adviser to provide us with potential investment opportunities.
We depend upon the Adviser to maintain its relationships with private equity sponsors, placement agents, investment banks, management groups and other financial institutions, and we expect to rely to a significant extent upon these relationships to provide us with potential investment opportunities. If the Adviser or members of our investment team fail to maintain such relationships, or to develop new relationships with other sources of investment opportunities, we will not be able to grow our investment portfolio. In addition, individuals with whom the Adviser has relationships are not obligated to provide us with investment opportunities, and we can offer no assurance that these relationships will generate investment opportunities for us in the future. Failure of the Adviser to maintain such relationships or enter into new relationships that would generate additional investment opportunities, could have a material adverse effect on our business.
The Adviser can resign on 60 days’ notice, and we may not be able to find a suitable replacement within that time, resulting in a disruption in our operations that could adversely affect our financial condition, business and results of operations.
The Adviser has the right to resign under the Advisory Agreement at any time upon not less than 60 days’ written notice, whether we have found a replacement or not. If the Adviser resigns, we may not be able to find a new investment adviser or hire internal management with similar expertise and ability to provide the same or equivalent services on acceptable terms within 60 days, or at all. If we are unable to do so quickly, our operations are likely to experience a disruption, our financial condition, business and results of operations as well as our ability to pay distributions are likely to be adversely affected and the market price of our common stock may decline. In addition, the coordination of our internal management and investment activities is likely to suffer if we are unable to identify and reach an agreement with a single institution or group of executives having the expertise possessed by the Adviser and its affiliates. Even if we are able to retain comparable management, whether internal or external, the integration of such management and their lack of familiarity with our investment objective may result in additional costs and time delays that may adversely affect our business, financial condition, results of operations and cash flows.
Our incentive fee may induce the Adviser to make certain investments, including speculative investments.
The management compensation structure that has been implemented under the Advisory Agreement may cause the Adviser to invest in high-risk investments or take other investment risks. In addition to its management fee, the Adviser is entitled under the Advisory Agreement to receive incentive compensation based in part upon our achievement of specified levels of income. In evaluating investments and other management strategies, the opportunity to earn incentive compensation based on net investment income may lead the Adviser to place undue emphasis on the maximization of net investment income at the expense of other criteria, such as preservation of capital, maintaining sufficient liquidity, or management of credit risk or market risk, in order to achieve higher incentive compensation. Investments with higher yield potential are generally riskier or more speculative. This could result in increased risk to the value of our investment portfolio.
29
We may be obligated to pay the Adviser incentive compensation even if we incur a net decrease in net assets.
The Advisory Agreement entitles the Adviser to incentive compensation for each fiscal quarter in an amount equal to a percentage of the excess of our net investment income for that quarter (before deducting the incentive fee) above a threshold return of 1.75% of our net assets, as adjusted, for that quarter. When calculating our incentive fee, our pre-incentive fee net investment income excludes realized losses and unrealized depreciation that we may incur in the fiscal quarter, even if such losses or depreciation result in a net decrease in net assets on our statement of operations for that quarter. Thus, we may be required to pay the Adviser incentive compensation for a fiscal quarter even if there is a decline in the value of our portfolio or we incur a net realized or unrealized loss for that quarter. For additional information on incentive compensation under the Advisory Agreement with the Adviser, see “Business — Investment Advisory and Management Agreement.”
We may be required to pay the Adviser incentive compensation on income accrued, but not yet received in cash.
The part of the incentive fee payable by us that relates to our net investment income is computed and paid on income that may include income that has been accrued but not yet received in cash, such as debt instruments with PIK interest. If a portfolio company defaults on a loan, it is possible that such accrued interest previously used in the calculation of the incentive fee will become uncollectible. Consequently, we may make incentive fee payments on income accruals that we may not collect in the future and with respect to which we do not have a clawback right against the Adviser. PIK income and any other non-cash income represented less than 1% of total investment income during the years ended March 31, 2017, 2016, and 2015.
The Adviser’s failure to identify and invest in securities that meet our investment criteria or perform its responsibilities under the Advisory Agreement would likely adversely affect our ability for future growth.
Our ability to achieve our investment objectives will depend on our ability to grow, which in turn will depend on the Adviser’s ability to identify and invest in securities that meet our investment criteria. Accomplishing this result on a cost-effective basis will be largely a function of the Adviser’s structuring of the investment process, its ability to provide competent and efficient services to us, and our access to financing on acceptable terms. The senior management team of the Adviser has substantial responsibilities under the Advisory Agreement. In order to grow, the Adviser will need to hire, train, supervise, and manage new employees successfully. Any failure to manage our future growth effectively would likely have a material adverse effect on our business, financial condition, and results of operations and cash flows.
There are significant potential conflicts of interest, including with the Adviser, which could impact our investment returns.
Our executive officers and directors, and the officers and directors of the Adviser, serve or may serve as officers, directors, or principals of entities that operate in the same or a related line of business as we do or of investment funds managed by our affiliates. Accordingly, they may have obligations to investors in those entities, the fulfillment of which might not be in the best interests of us or our stockholders. For example, Mr. Gladstone, our chairman and chief executive officer, is the chairman of the board and chief executive officer of the Adviser and Administrator, and the Affiliated Public Funds. In addition, Mr. Brubaker, our vice chairman and chief operating officer, is the vice chairman and chief operating officer of the Adviser and Administrator, and the Affiliated Public Funds. Mr. Dullum, our president, is an executive managing director of the Adviser. Moreover, the Adviser may establish or sponsor other investment vehicles which from time to time may have potentially overlapping investment objectives with ours and accordingly may invest in, whether principally or secondarily, asset classes we target. While the Adviser generally has broad authority to make investments on behalf of the investment vehicles that it advises, the Adviser has adopted investment allocation procedures to address these potential conflicts and intends to direct investment opportunities to the Company or the Affiliated Public Fund with the investment strategy that most closely fits the investment opportunity. Nevertheless, the management of the Adviser may face conflicts in the allocation of investment opportunities to other entities managed by the Adviser. As a result, it is possible that we may not be given the opportunity to participate in certain investments made by other funds managed by the Adviser. Our Board of Directors approved a revision of our investment objectives and strategies that became effective on January 1, 2013, which may enhance the potential for conflicts in the allocation of investment opportunities to us and other entities managed by the Adviser.
In certain circumstances, we may make investments in a portfolio company in which one of our affiliates has or will have an investment, subject to satisfaction of any regulatory restrictions and, where required, the prior approval of our Board of Directors. As of March 31, 2017, our Board of Directors has approved the following types of transactions:
| • | Our affiliate, Gladstone Commercial, may, under certain circumstances, lease property to portfolio companies that we do not control. We may pursue such transactions only if (i) the portfolio company is not controlled by us or any of our affiliates, (ii) the portfolio company satisfies the tenant underwriting criteria of Gladstone Commercial, and (iii) the transaction is approved by a majority of our independent directors and a majority of the independent directors of Gladstone Commercial. We expect that any such negotiations between Gladstone Commercial and our portfolio companies would result in lease terms consistent with the terms that the portfolio companies would be likely to receive were they not portfolio companies of ours. |
30
| • | We may invest simultaneously with our affiliate Gladstone Capital in senior loans in the broadly syndicated market whereby neither we nor any affiliate has the ability to dictate the terms of the loans. |
| • | Pursuant to the Co-Investment Order, under certain circumstances, we may co-invest with Gladstone Capital and any future BDC or closed-end management investment company that is advised by the Adviser (or sub-advised by the Adviser if it controls the fund) or any combination of the foregoing subject to the conditions included therein. |
Certain of our officers, who are also officers of the Adviser, may from time to time serve as directors of certain of our portfolio companies. If an officer serves in such capacity with one of our portfolio companies, such officer will owe fiduciary duties to stockholders of the portfolio company, which duties may from time to time conflict with the interests of our stockholders.
In the course of our investing activities, we will pay management and incentive fees to the Adviser and will reimburse the Administrator for certain expenses it incurs. As a result, investors in our common stock will invest on a “gross” basis and receive distributions on a “net” basis after expenses, resulting in, among other things, a lower rate of return than one might achieve through our investors themselves making direct investments. As a result of this arrangement, there may be times when the management team of the Adviser has interests that differ from those of our stockholders, giving rise to a conflict. In addition, as a BDC, we make available significant managerial assistance to our portfolio companies and provide other services to such portfolio companies. While neither we nor the Adviser currently receive fees in connection with managerial assistance, the Adviser and Gladstone Securities have, at various times, provided other services to certain of our portfolio companies and received fees for services other than managerial assistance as discussed in “Business – Ongoing Management of Investment Portfolio Company Relationships – Managerial Assistance and Services.”
Our business model is dependent upon developing and sustaining strong referral relationships with investment bankers, business brokers and other intermediaries and any change in our referral relationships may impact our business plan.
We are dependent upon informal relationships with investment bankers, business brokers and traditional lending institutions to provide us with deal flow. If we fail to maintain our relationship with such funds or institutions, or if we fail to establish strong referral relationships with other funds, we will not be able to grow our portfolio of investments and fully execute our business plan.
The Adviser is not obligated to provide credits of the base management fee or incentive fees, which could negatively impact our earnings and our ability to maintain our current level of distributions to our stockholders.
The Advisory Agreement provides for a base management fee, based on our gross assets, and an incentive fee, that is based on our income and capital gains. Our Board of Directors has accepted in the past and may accept in the future non-contractual, unconditional, and irrevocable credits to reduce the annual 2.0% base management fee or the incentive fee, on a quarterly or annual basis. Any fees credited may not be recouped by the Adviser in the future. However, the Adviser is not required to issue these or other credits of fees under the Advisory Agreement. If the Adviser does not issue these credits in the future, it could negatively impact our earnings and may compromise our ability to maintain our current level of distributions to our stockholders, which could have a material adverse impact on our common stock price.
Our base management fee may induce the Adviser to incur leverage.
The fact that our base management fee is payable based upon our gross assets, which would include any investments made with proceeds of borrowings, may encourage the Adviser to use leverage to make additional investments. Under certain circumstances, the use of increased leverage may increase the likelihood of default, which would disfavor holders of our securities. Given the subjective nature of the investment decisions made by the Adviser on our behalf, we will not be able to monitor this potential conflict of interest.
Risks Related to an Investment in Our Securities
We may experience fluctuations in our quarterly and annual operating results.
We may experience fluctuations in our quarterly and annual operating results due to a number of factors, including, among others, variations in our investment income, the level of our expenses, variations in and the timing of the recognition of realized and unrealized gains or losses, placing and removing investments on non-accrual status, the degree to which we encounter competition in our markets, the ability to sell investments at attractive terms, the ability to fund and close suitable investments, the degree to which we encounter competition in our markets, and general economic conditions, including the impacts of inflation. The majority of our
31
portfolio companies are in industries that are directly impacted by inflation, such as manufacturing and consumer goods and services. Our portfolio companies may not be able to pass on to customers increases in their costs of production which could greatly affect their operating results, impacting their ability to service and repay our loans. In addition, any projected future decreases in our portfolio companies’ operating results due to inflation could adversely impact the fair value of those investments. Any decreases in the fair value of our investments could result in future realized and unrealized losses and therefore reduce our net assets. As a result of these factors, results for any period should not be relied upon as being indicative of performance in future periods.
There is a risk that you may not receive distributions or that distributions may not grow over time.
Our current intention is to distribute at least 90% of our Investment Company Taxable Income to our stockholders by paying monthly distributions. We may retain some or all realized long-term capital gains by first offsetting them with realized capital losses, and, secondly, through a “deemed distribution” to supplement our equity capital and support the growth of our portfolio, although our Board of Directors may determine to distribute these net long-term capital gains to our stockholders in cash. In addition, the Credit Facility restricts the amount of distributions we are permitted to make annually. We cannot assure investors that we will achieve investment results or maintain a tax status that will allow or require any specified level of cash distributions.
Investing in our securities may involve an above average degree of risk.
The investments we make in accordance with our investment objective may result in a higher amount of risk than alternative investment options and a higher risk of volatility or loss of principal. Our investments in portfolio companies may be highly speculative, and therefore, an investment in our common stock may not be suitable for someone with lower risk tolerance.
Distributions to our common stockholders have included and may in the future include a return of capital.
Our Board of Directors declares monthly common distributions each quarter based on estimates of Investment Company Taxable Income for each fiscal year, which may differ, and in the past have differed, from actual results. Because our common distributions are based on estimates of Investment Company Taxable Income that may differ from actual results, future common distributions payable to our common stockholders may include a return of capital. Moreover, to the extent that we distribute amounts that exceed our accumulated earnings and profits, these distributions constitute a return of capital. A return of capital represents a return of a common stockholder’s original investment in common shares of our stock and should not be confused with a distribution from earnings and profits. Although return of capital distributions may not be taxable, such distributions may increase an investor’s tax liability for capital gains upon the sale of our common stock by reducing the investor’s tax basis for such common stock. Such returns of capital reduce our asset base and also adversely impact our ability to raise debt capital as a result of the leverage restrictions under the 1940 Act, which could have a material adverse impact on our ability to make new investments.
The market price of our shares may fluctuate significantly.
The trading price of our common stock and our preferred stock may fluctuate substantially. Due to the volatility and disruptions that have affected the capital and credit markets over the past few years, our stock has experienced greater than usual price volatility.
The market price and marketability of our shares may from time to time be significantly affected by numerous factors, including many over which we have no control and that may not be directly related to us. These factors include, but are not limited to, the following:
| • | General economic trends and other external factors, such as inflation, oil and gas prices, and gross domestic product growth; |
| • | Price and volume fluctuations in the stock market from time to time, which are often unrelated to the operating performance of particular companies; |
| • | Significant volatility in the market price and trading volume of shares of RICs, BDCs or other companies in our sector, which is not necessarily related to the operating performance of these companies; |
| • | Changes in stock index definitions or policies, which may impact an investor’s desire to hold shares of BDCs; |
| • | Changes in regulatory policies or tax guidelines, particularly with respect to RICs or BDCs; |
| • | Loss of BDC status; |
| • | Loss of RIC status; |
32
| • | Changes in our earnings or variations in our operating results; |
| • | Changes and perceived projected changes in prevailing interest rates; |
| • | Changes in the value of our portfolio of investments; |
| • | Any shortfall in our revenue or net income or any increase in losses from levels expected by securities analysts; |
| • | Departure of key personnel; |
| • | Operating performance of companies comparable to us; |
| • | Short-selling pressure with respect to our shares or BDCs generally; |
| • | The announcement of proposed, or completed, offerings of our securities, including a rights offering; and |
| • | Loss of a major funding source. |
Fluctuations in the trading prices of our shares may adversely affect the liquidity of the trading market for our shares and, if we seek to raise capital through future equity financings, our ability to raise such equity capital.
Common shares of closed-end investment companies frequently trade at a discount from NAV.
Shares of closed-end investment companies frequently trade at a discount from NAV per common share. Since our inception, our common stock has at times traded above NAV and at times below NAV. During the past year, our common stock has at times traded significantly below NAV. Subsequent to March 31, 2017, and through May 12, 2017, our common stock has traded at discounts of up to 10.6% of our NAV per share, which was $9.95 as of March 31, 2017. This characteristic of shares of closed-end investment companies is separate and distinct from the risk that our NAV per share will decline. As with any stock, the price of our common shares will fluctuate with market conditions and other factors. If common shares are sold, the price received may be more or less than the original investment. Whether investors will realize gains or losses upon the sale of our shares will not depend directly upon our NAV, but will depend upon the market price of the shares at the time of sale. Since the market price of our common shares will be affected by such factors as the relative demand for and supply of the shares in the market, general market and economic conditions and other factors beyond our control, we cannot predict whether the common shares will trade at, below or above our NAV. Under the 1940 Act, we are generally not able to issue additional shares of our common stock at a price below NAV per share to purchasers other than our existing common stockholders through a rights offering without first obtaining the approval of our stockholders and our independent directors. Additionally, at times when our common stock is trading below its NAV per share, our dividend yield may exceed the weighted average returns that we would expect to realize on new investments that would be made with the proceeds from the sale of such stock, making it unlikely that we would determine to issue additional common shares in such circumstances. Thus, for as long as our common stock may trade below NAV, we generally will be subject to significant constraints on our ability to raise capital through the issuance of common stock. Additionally, an extended period of time in which we are unable to raise capital may restrict our ability to grow and adversely impact our ability to increase or maintain our distributions.
Common stockholders may incur dilution if we sell shares of our common stock in one or more offerings at prices below the then current NAV per share.
At our most recent annual meeting of stockholders on August 4, 2016, our stockholders approved a proposal designed to allow us to sell shares of our common stock below the then current NAV per share in one or more offerings for a period of one year from the date of such approval, subject to certain conditions (including, but not limited to, that the number of common shares issued and sold pursuant to such authority does not exceed 25% of our then outstanding common stock immediately prior to each such sale).
Subject to the approval from our stockholders, we exercised this right with Board of Director approval in May 2017, when we completed a public offering of 2.1 million shares of our common stock at a public offering price of $9.38 per share, which was below our then current estimated NAV of $9.95 per share. Gross proceeds totaled $19.7 million and net proceeds, after deducting underwriting discounts and commissions and estimated offering costs borne by us, were $18.6 million. The underwriters also have a 30-day option expiring on June 8, 2017 to purchase up to 315,000 additional shares of common stock on the same terms and conditions solely to cover over-allotments, if any. The net dilutive effect of the issuance of common stock, net of estimated expenses, below NAV was $0.19 per share of common stock.
33
Subject to a previous approval from our stockholders, we exercised this right with Board of Director approval in March 2015, when we completed a public offering of 3.3 million shares of our common stock at a public offering price of $7.40 per share, which was below our then current NAV of $8.55 per share. Gross proceeds totaled $24.4 million and net proceeds, after deducting underwriting discounts and offering costs borne by us, were $23.0 million. In April 2015, the underwriters exercised their option to purchase an additional 495,000 shares at the public offering price of $7.40 per share to cover over-allotments, which resulted in gross proceeds of $3.7 million and net proceeds, after deducting underwriting discounts and offering costs borne by us, of $3.4 million. The net dilutive effect of the issuance of common stock, net of expenses, below NAV was $0.25 per share of common stock.
Additionally and subject to a previous approval from our stockholders, we also exercised this right with our Board of Director’s approval in October 2012, when we completed a public offering of 4.4 million shares of our common stock at a public offering price of $7.50 per share, which was below our then current NAV of $8.65 per share. Gross proceeds totaled $33.0 million and net proceeds, after deducting underwriting discounts and offering costs borne by us, were $31.0 million. The net dilutive effect of the issuance of common stock, net of expenses, below NAV was $0.31 per share of common stock.
At the upcoming annual stockholders meeting scheduled for August 3, 2017, we expect that our stockholders will again be asked to vote in favor of renewing this proposal for another year. During the past year, our common stock has traded consistently, and at times significantly, below NAV. Any decision to sell shares of our common stock below the then current NAV per share of our common stock would be subject to the determination by our Board of Directors that such issuance is in our and our stockholders’ best interests.
If we were to sell shares of our common stock below NAV per share, such sales would result in an immediate dilution to the NAV per share. This dilution would occur as a result of the sale of shares at a price below the then current NAV per share of our common stock and a proportionately greater decrease in a common stockholder’s interest in our earnings and assets and voting interest in us than the increase in our assets resulting from such issuance. The greater the difference between the sale price and the NAV per share at the time of the offering, the more significant the dilutive impact would be. Because the number of shares of common stock that could be so issued and the timing of any issuance is not currently known, the actual dilutive effect, if any, cannot be currently predicted. However, if, for example, we sold an additional 10% of our common stock at a 5% discount from NAV, an existing common stockholder who did not participate in that offering for its proportionate interest would suffer NAV dilution of up to 0.5% or $5 per $1,000 of NAV.
If we fail to pay dividends on our mandatorily redeemable preferred stock for two years, the holders of our preferred stock will be entitled to elect a majority of our directors.
The terms of our three series of mandatorily redeemable preferred stock provide for annual dividends of $1.6875, $1.6250 and $1.5625 per outstanding share of our Series B Term Preferred Stock, Series C Term Preferred Stock and Series D Term Preferred Stock, respectively. In accordance with the terms of each of our three series of mandatorily redeemable term preferred stock, if dividends thereon are unpaid in an amount equal to at least two years of dividends, the holders of such series of stock will be entitled to elect a majority of our Board of Directors.
Other Risks
Uncertainty in the current global market and the condition of the U.S. debt and equity capital markets could negatively impact our financial condition and stock price.
In the recent past, the global capital markets experienced periods of disruption resulting from a lack of liquidity in parts of the debt capital markets, significant write-offs in the financial services sector, and other factors. These events led to a general decline in U.S. economic conditions and the overall confidence in the debt and equity markets. While the market has since improved and investors have regained confidence, the macroeconomic environment and recovery from the downturn has been challenging and inconsistent and remains uncertain given the global economic effects of recent events, including the United Kingdom’s exit from the European Union and proposed amendments to certain regulations from the new Administration. Instability in the credit markets, the impact of periodic uncertainty regarding the U.S. federal budget, tapering of bond purchases by the Fed and debt ceiling, the instability in the geopolitical environment in many parts of the world, sovereign debt conditions in Europe and other disruptions may continue to put pressure on economic conditions in the U.S. and abroad, all of which can have an adverse effect on our business. We do not know how long the financial markets will continue to be affected by these events or how severely such effect may be and cannot predict the effects of these or similar events in the future on the U.S. economy and securities markets or on our investments. We monitor developments and seek to manage our investments in a manner consistent with achieving our investment objective, but there can be no assurance that we will be successful in doing so.
34
Economic recessions or downturns could impair our portfolio companies and harm our operating results.
Many of our portfolio companies may be susceptible to economic downturns or recessions and may be unable to repay our loans during these periods. Therefore, during these periods, our non-performing assets may increase and the value of these assets may decrease. Adverse economic conditions may also decrease the value of collateral securing some of our loans and the value of our equity investments. Economic slowdowns or recessions could lead to financial losses in our portfolio and a decrease in investment income, net investment income and assets. Unfavorable economic conditions also could increase our funding costs, limit our access to the capital markets or result in a decision by lenders not to extend credit to us. These events could prevent us from increasing investments and harm our operating results. We experienced to some extent such effects as a result of the economic downturn that occurred from 2008 through 2009 and may experience such effects again in any future downturn or recession.
We could face losses and potential liability if intrusion, viruses or similar disruptions to our technology jeopardize our confidential information, whether through breach of our network security or otherwise.
Maintaining our network security is of critical importance because our systems store highly confidential financial models and portfolio company information. Although we have implemented, and will continue to implement and upgrade, security measures, our technology platform is and will continue to be vulnerable to intrusion, computer viruses or similar disruptive problems caused by transmission from unauthorized users. The misappropriation of proprietary information could expose us to a risk of loss or litigation.
Terrorist attacks, acts of war, or national disasters may affect any market for our stock, impact the businesses in which we invest, and harm our business, operating results, and financial conditions.
Terrorist acts, acts of war, or national disasters have created, and continue to create, economic and political uncertainties and have contributed to global economic instability. Future terrorist activities, military or security operations, or national disasters could further weaken the domestic/global economies and create additional uncertainties, which may negatively impact the businesses in which we invest directly or indirectly and, in turn, could have a material adverse impact on our business, operating results, and financial condition. Losses from terrorist attacks and national disasters are generally uninsurable.
| ITEM 1B. | UNRESOLVED STAFF COMMENTS |
None.
We do not own any real estate or other physical properties material to our operations. The Adviser is the current leaseholder of all properties in which we operate. We occupy these premises pursuant to our Advisory and Administration Agreements with the Adviser and Administrator, respectively. The Adviser and Administrator are both headquartered in McLean, Virginia, a suburb of Washington, D.C., and the Adviser also has offices in other states.
From time to time, we may become involved in various investigations, claims and legal proceedings that arise in the ordinary course of our business. Furthermore, third parties may try to seek to impose liability on us in connection with the activities of our portfolio companies. See “Risk Factors – Portfolio company-related litigation could result in costs, including defense costs or damages, and the diversion of management time and resources.” While we do not expect that the resolution of these matters, if they arise, would materially affect our business, financial condition, results of operations or cash flows, resolution will be subject to various uncertainties and could result in the expenditure of significant financial and managerial resources.
ITEM 4. MINE SAFETY DISCLOSURES
Not Applicable.
35
PART II
ITEM 5. MARKET FOR REGISTRANT’S COMMON EQUITY, RELATED STOCKHOLDER MATTERS AND ISSUER PURCHASES OF EQUITY SECURITIES
Our common stock is traded on NASDAQ under the symbol “GAIN.” The following table reflects, by quarter, the high and low intraday sales prices per share of our common stock on the NASDAQ, the intraday sales prices as a percentage of NAV and quarterly distributions declared per common share for each fiscal quarter during the last two fiscal years. Amounts presented for each fiscal quarter of 2017 and 2016 represent the cumulative amount of the distributions declared per common share for the months composing such quarter.
| Quarter Ended |
Sales Prices | Discount of High to NAV(B) |
Discount of Low to NAV(B) |
Declared Common Stock Distributions |
||||||||||||||||||||||
| NAV(A) | High | Low | ||||||||||||||||||||||||
| FY 2017 |
6/30/2016 | $ | 9.84 | $ | 7.24 | $ | 6.65 | 26 | % | 32 | % | $ | 0.1875 | |||||||||||||
| 9/30/2016 | 9.65 | 9.30 | 7.16 | 4 | 26 | 0.1875 | ||||||||||||||||||||
| 12/31/2016 | 9.82 | 9.15 | 7.16 | 7 | 27 | 0.1875 | ||||||||||||||||||||
| 3/31/2017 | 9.95 | 9.36 | 8.45 | 6 | 15 | 0.1875 | ||||||||||||||||||||
| FY 2016 |
6/30/2015 | $ | 9.24 | $ | 8.10 | $ | 7.35 | 12 | % | 20 | % | $ | 0.1875 | |||||||||||||
| 9/30/2015 | 9.05 | 8.25 | 6.66 | 9 | 26 | 0.1875 | ||||||||||||||||||||
| 12/31/2015 | 8.66 | 8.00 | 6.96 | 8 | 20 | 0.1875 | ||||||||||||||||||||
| 3/31/2016 | 9.22 | 7.96 | 6.40 | 14 | 31 | 0.1875 | ||||||||||||||||||||
| (A) | NAV per share is determined as of the last day in the relevant quarter and therefore may not reflect the NAV per share on the date of the high and low intraday sales prices. The NAVs shown are based on outstanding shares at the end of each period. |
| (B) | The discounts set forth in these columns represent the high or low, as applicable, intraday sale prices per share for the relevant quarter minus the NAV per share as of the end of such quarter, and therefore may not reflect the discount to NAV per share on the date of the high and low intraday sales prices. |
As of May 12, 2017, there were 22 record owners of our common stock. This number does not include stockholders for whom shares are held in “street name.”
Distributions
We generally intend to distribute, in the form of cash distributions, a minimum of 90% of our Investment Company Taxable Income, if any, to our stockholders in the form of monthly distributions. We may retain some or all of our net long-term capital gains, if any, but we generally intend to distribute such gains to stockholders in cash or to designate them as a deemed distribution to supplement our equity capital and support the growth of our portfolio.
The Credit Facility also generally seeks to restrict distributions on our common stock to the sum of certain amounts, including, but not limited to, our net investment income, plus net capital gains, plus amounts elected by the Company to be considered as having been paid during the prior fiscal year in accordance with Section 855(a) of the Code.
Recent Sales of Unregistered Securities
We did not sell any unregistered shares of stock during the fiscal year ended March 31, 2017.
Purchases of Equity Securities
We did not repurchase any of our shares of stock during the fourth quarter ended March 31, 2017.
36
Stock Performance Graph
The following graph shows the total stockholder return on an investment of $100 in cash on March 31, 2012 for (i) our common stock, (ii) the NASDAQ’s 100 index (“NASDAQ 100”), (iii) the Russell 1000 index (“Russell 1000”) and (iv) a peer group made up of publicly traded business development companies. Out peer group is composed of Ares Capital Corporation, Main Street Capital Corporation, MVC Capital, Inc., and Pennantpark Investment Corp. The returns of each company assume reinvestment of dividends and have been weighted according to their respective stock market capitalization for purposes of arriving at a peer group average.
Comparison Cumulative Total Return on Investment (in dollars)
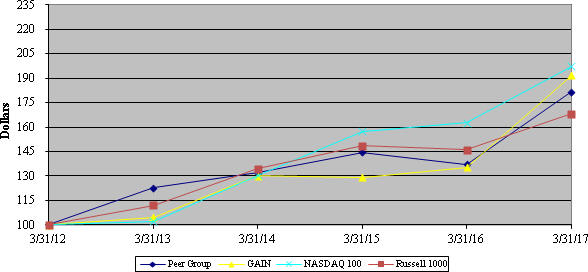
| GAIN | NASDAQ 100 | Russell 1000 | Peer Group | |||||||||||||
| 3/31/2012 | $ | 100.00 | $ | 100.00 | $ | 100.00 | $ | 100.00 | ||||||||
| 3/31/2013 | 104.73 | 102.30 | 111.96 | 122.68 | ||||||||||||
| 3/31/2014 | 130.14 | 130.50 | 134.34 | 131.89 | ||||||||||||
| 3/31/2015 | 129.13 | 157.29 | 148.53 | 144.59 | ||||||||||||
| 3/31/2016 | 135.35 | 162.73 | 146.21 | 137.07 | ||||||||||||
| 3/31/2017 | 191.78 | 197.30 | 168.19 | 181.76 | ||||||||||||
37
ITEM 6. SELECTED FINANCIAL DATA
The following consolidated selected financial data as of and for the fiscal years ended March 31, 2017, 2016, 2015, 2014, and 2013, are derived from our audited accompanying Consolidated Financial Statements. The other data included in the second table below is unaudited. The data should be read in conjunction with our audited accompanying Consolidated Financial Statements and notes thereto and “Management’s Discussion and Analysis of Financial Condition and Results of Operations” included elsewhere in this report.
GLADSTONE INVESTMENT CORPORATION
CONSOLIDATED SELECTED FINANCIAL AND OTHER DATA
(DOLLAR AMOUNTS IN THOUSANDS, EXCEPT PER SHARE DATA)
| Year Ended March 31, | ||||||||||||||||||||
| 2017 | 2016 | 2015 | 2014 | 2013 | ||||||||||||||||
| Statement of Operations Data: |
||||||||||||||||||||
| Total investment income |
$ | 51,875 | $ | 50,955 | $ | 41,643 | $ | 36,264 | $ | 30,538 | ||||||||||
| Total expenses, net of credits from Adviser |
29,453 | 30,239 | 21,746 | 16,957 | 14,050 | |||||||||||||||
|
|
|
|
|
|
|
|
|
|
|
|||||||||||
| Net investment income |
22,422 | 20,716 | 19,897 | 19,307 | 16,488 | |||||||||||||||
|
|
|
|
|
|
|
|
|
|
|
|||||||||||
| Net realized and unrealized gain (loss) |
22,341 | 4,138 | 30,317 | (20,636 | ) | 791 | ||||||||||||||
|
|
|
|
|
|
|
|
|
|
|
|||||||||||
| Net increase (decrease) in net assets resulting from operations |
$ | 44,763 | $ | 24,854 | $ | 50,214 | $ | (1,329 | ) | $ | 17,279 | |||||||||
|
|
|
|
|
|
|
|
|
|
|
|||||||||||
| Per Common Share Data: |
||||||||||||||||||||
| Net increase (decrease) in net assets resulting from operations per common share — basic and diluted(A) |
$ | 1.48 | $ | 0.82 | $ | 1.88 | $ | (0.05 | ) | $ | 0.71 | |||||||||
| Net investment income before net gain (loss) per common share — basic and diluted(A) |
0.74 | 0.68 | 0.75 | 0.73 | 0.68 | |||||||||||||||
| Cash distributions declared per common share(B) |
0.75 | 0.75 | 0.77 | 0.71 | 0.60 | |||||||||||||||
| Statement of Assets and Liabilities Data: |
||||||||||||||||||||
| Total assets |
$ | 515,195 | $ | 506,260 | $ | 483,521 | $ | 330,694 | $ | 379,803 | ||||||||||
| Net assets |
301,082 | 279,022 | 273,429 | 220,837 | 240,963 | |||||||||||||||
| Net asset value per common share |
9.95 | 9.22 | 9.18 | 8.34 | 9.10 | |||||||||||||||
| Common shares outstanding |
30,270,958 | 30,270,958 | 29,775,958 | 26,475,958 | 26,475,958 | |||||||||||||||
| Weighted common shares outstanding — basic and diluted |
30,270,958 | 30,268,253 | 26,665,821 | 26,475,958 | 24,189,148 | |||||||||||||||
| Senior Securities Data: |
||||||||||||||||||||
| Total borrowings, at cost(C) |
$ | 74,796 | $ | 100,096 | $ | 123,896 | $ | 66,250 | $ | 94,016 | ||||||||||
| Mandatorily redeemable preferred stock(D) |
139,150 | 121,650 | 81,400 | 40,000 | 40,000 | |||||||||||||||
| (A) | Per share data is based on the weighted average common stock outstanding for both basic and diluted. |
| (B) | The tax character of distributions is determined on an annual basis. For further information on the estimated character of our distributions to common stockholders, please refer to Note 9 — Distributions to Common Stockholders included elsewhere in this Annual Report on Form 10-K. |
| (C) | Includes borrowings under the Credit Facility, other secured borrowings, and short-term loans, as applicable. |
| (D) | Represents the total liquidation preference of our mandatorily redeemable preferred stock. |
| Year Ended March 31, | ||||||||||||||||||||
| Other Unaudited Data: | 2017 | 2016 | 2015 | 2014 | 2013 | |||||||||||||||
| Number of portfolio companies |
35 | 36 | 34 | 29 | 21 | |||||||||||||||
| Average size of portfolio company investment at cost |
$ | 15,005 | $ | 14,392 | $ | 14,861 | $ | 13,225 | $ | 15,544 | ||||||||||
| Principal amount of new investments |
54,370 | 69,380 | 108,197 | 132,291 | 87,607 | |||||||||||||||
| Proceeds from loan repayments and investments sold |
68,825 | 44,582 | 11,260 | 83,415 | 28,424 | |||||||||||||||
| Weighted average yield on investments(A) |
12.65 | % | 12.62 | % | 12.60 | % | 12.61 | % | 12.51 | % | ||||||||||
| Total return(B) |
41.58 | 4.82 | 11.96 | 24.26 | 4.73 | |||||||||||||||
| (A) | Weighted average yield on investments equals interest income earned on investments divided by the weighted average interest-bearing principal balance throughout the fiscal year. |
| (B) | Total return equals the change in the ending market value of our common stock from the beginning of the fiscal year, taking into account common dividends reinvested in accordance with the terms of the dividend reinvestment plan. Total return does not take into account common distributions that may be characterized as a return of capital. For further information on the estimated character of our distributions to common stockholders, please refer to Note 9 — Distributions to Common Stockholders included elsewhere in this Annual Report on Form 10-K. |
38
ITEM 7. MANAGEMENT’S DISCUSSION AND ANALYSIS OF FINANCIAL CONDITION AND RESULTS OF OPERATIONS
The following analysis of our financial condition and results of operations should be read in conjunction with our accompanying Consolidated Financial Statements and the notes thereto contained elsewhere in this Annual Report on Form 10-K. Historical financial condition and results of operations and percentage relationships among any amounts in the financial statements are not necessarily indicative of financial condition, results of operations or percentage relationships for any future periods. Except per share amounts, dollar amounts in the tables included herein are in thousands unless otherwise indicated.
OVERVIEW
General
We were incorporated under the General Corporation Laws of the State of Delaware on February 18, 2005. On June 22, 2005, we completed our initial public offering and commenced operations. We operate as an externally managed, closed-end, non-diversified management investment company and have elected to be treated as a BDC under the 1940 Act. For federal income tax purposes, we have elected to be treated as a RIC under Subchapter M of the Code. In order to continue to qualify as a RIC for federal income tax purposes and obtain favorable RIC tax treatment, we must meet certain requirements, including certain minimum distribution requirements.
We were established for the purpose of investing in debt and equity securities of established private businesses operating in the U.S. Our investment objectives are to: (i) achieve and grow current income by investing in debt securities of established businesses that we believe will provide stable earnings and cash flow to pay expenses, make principal and interest payments on our outstanding indebtedness and make distributions to stockholders that grow over time; and (ii) provide our stockholders with long-term capital appreciation in the value of our assets by investing in equity securities, generally in combination with the aforementioned debt securities, of established businesses that we believe can grow over time to permit us to sell our equity investments for capital gains. To achieve our objectives, our investment strategy is to invest in several categories of debt and equity securities, with individual investments generally totaling up to $30 million, although investment size may vary, depending upon our total assets or available capital at the time of investment. We intend that our investment portfolio over time will consist of approximately 75% in debt securities and 25% in equity securities, at cost. As of March 31, 2017, our investment portfolio was made up of 72.0% in debt securities and 28.0% in equity securities, at cost.
We focus on investing in Lower Middle Market private businesses in the U.S. that meet certain criteria, including, but not limited to, the following: the sustainability of the business’ free cash flow and its ability to grow it over time, adequate assets for loan collateral, experienced management teams with a significant ownership interest in the borrower, reasonable capitalization of the borrower, including an ample equity contribution or cushion based on prevailing enterprise valuation multiples, and the potential to realize appreciation and gain liquidity in our equity position, if any. We anticipate that liquidity in our equity position will be achieved through a merger or acquisition of the borrower, a public offering of the borrower’s stock or by exercising our right to require the borrower to repurchase our warrants, though there can be no assurance that we will always have these rights. We lend to borrowers that need funds for growth capital or to finance acquisitions or recapitalize or refinance their existing debt facilities. We seek to avoid investing in high-risk, early-stage enterprises.
We invest by ourselves or jointly with other funds and/or management of the portfolio company, depending on the opportunity, and have opportunistically made several co-investments with our affiliate Gladstone Capital pursuant to the Co-Investment Order. We believe the Co-Investment Order has enhanced and will continue to enhance our ability to further our investment objectives and strategies. If we are participating in an investment with one or more co-investors, whether or not an affiliate of ours, our investment is likely to be smaller than if we were investing alone.
Business
Portfolio Activity
While the business environment remains competitive, we continue to see new investment opportunities consistent with our investment strategy of providing a combination of debt and equity in support of management and sponsor-led buyouts of Lower Middle Market companies in the U.S. For the fiscal year ended March 31, 2017, we invested a total of $54.4 million in two new portfolio companies and exited three existing portfolio companies with a combined fair value prior to their sales of $70.8 million resulting in a net reduction of one company from our portfolio, which was comprised of 35 companies as of March 31, 2017. From our initial public offering in June 2005 through March 31, 2017, we have made investments in 45 companies, excluding investments in syndicated loans, for a total of approximately $914 million, before giving effect to principal repayments and divestures.
39
The majority of the debt securities in our portfolio have a success fee component, which enhances the yield on our debt investments. Unlike PIK income, we generally do not recognize success fees as income until they are received in cash. Due to the contingent nature of success fees, there are no guarantees that we will be able to collect any or all of these success fees or know the timing of such collections. As a result, as of March 31, 2017, we had unrecognized, contractual success fees of $24.2 million, or $0.80 per common share. Consistent with GAAP, we generally have not recognized our success fee receivable and related income in our Consolidated Financial Statements until earned.
From inception through March 31, 2017, we have completed ten buyout liquidity events, which, in the aggregate, have generated $84.3 million in net realized gains and $20.3 million in other income upon exit, for a total increase to our net assets of $104.6 million. We believe each of these transactions was an equity-oriented investment success and exemplifies our investment strategy of striving to achieve returns through current income on the debt portion of our investments and capital gains from the equity portion. The ten liquidity events have offset our cumulative realized losses since inception, which were primarily incurred during the recession in connection with the sale of performing syndicated loans at a realized loss to pay off a former lender. These successful exits, in part, enabled us to increase the monthly distribution by 56.3% since March 2011 and through March 31, 2017, and allowed us to declare and pay a $0.03 per common share special distribution in fiscal year 2012, a $0.05 per common share special distribution in November 2013, and a $0.05 per common share special distribution in December 2014.
Capital Raising Efforts
We have been able to meet our capital needs through extensions of and increases to the Credit Facility and by accessing the capital markets in the form of public offerings of common and preferred stock. We have successfully extended the Credit Facility’s revolving period multiple times, most recently to November 2019, and currently have a total commitment amount of $165.0 million (with a potential total commitment of $250.0 million through additional commitments of new or existing lenders). Additionally, we issued approximately 2.1 million shares of common stock for gross process of $19.7 million in May 2017 and 3.8 million shares of common stock for gross proceeds of $28.1 million in March 2015, inclusive of the April 2015 overallotment, approximately 1.7 million shares of our Series B Term Preferred Stock for gross proceeds of $41.4 million in November 2014, approximately 1.6 million shares of our Series C Term Preferred Stock for gross proceeds of $40.3 million in May 2015, and 2.3 million shares of our Series D Term Preferred Stock for gross proceeds of $57.5 million in September 2016. Refer to “Liquidity and Capital Resources — Equity — Common Stock” and “Liquidity and Capital Resources — Equity — Term Preferred Stock” for further discussion of our common stock and mandatorily redeemable preferred stock and “Liquidity and Capital Resources — Revolving Line of Credit” for further discussion of the Credit Facility.
Although we were able to access the capital markets historically, we believe market conditions continue to affect the trading price of our common stock and thus our ability to finance new investments through the issuance of common equity. On May 12, 2017, the closing market price of our common stock was $9.20, which represented a 7.5% discount to our March 31, 2017 NAV per share of $9.95. When our common stock trades below NAV, our ability to issue additional equity is constrained by provisions of the 1940 Act, which generally prohibits the issuance and sale of our common stock at an issuance price below the then current NAV per share without stockholder approval, other than through sales to our then-existing stockholders pursuant to a rights offering.
At our 2016 Annual Meeting of Stockholders held on August 4, 2016, our stockholders approved a proposal authorizing us to issue and sell shares of our common stock at a price below our then current NAV per share, subject to certain limitations, including that the number of common shares issued and sold pursuant to such authority does not exceed 25.0% of our then outstanding common stock immediately prior to each such sale, provided that our Board of Directors makes certain determinations prior to any such sale. This August 2016 stockholder authorization is in effect for one year from the date of stockholder approval. We sought and obtained stockholder approval concerning similar proposals at each Annual Meeting of Stockholders since 2008, and with our Board of Directors’ subsequent approval, we issued shares of our common stock in three offerings at a price below the then current NAV per share, once in May 2017, once in March and April 2015, and once in October and November 2012. The resulting proceeds, in part, have allowed us to grow the portfolio by making new investments, generate additional income through these new investments, provide us additional equity capital to help ensure continued compliance with regulatory tests and increase our debt capital while still complying with our applicable debt-to-equity ratios. Refer to “Liquidity and Capital Resources — Equity — Common Stock” for further discussion of our common stock.
Regulatory Compliance
Our ability to seek external debt financing, to the extent that it is available under current market conditions, is further subject to the asset coverage limitations of the 1940 Act, which require us to have an asset coverage ratio (as defined in Sections 18 and 61 of the
40
1940 Act), of at least 200.0% on each of our senior securities representing indebtedness and our senior securities that are stock (such as our three series of term preferred stock). As of March 31, 2017, our asset coverage ratio on our senior securities representing indebtedness was 661.3% and our asset coverage ratio on our senior securities that are stock was 235.6%.
Investment Highlights
For the fiscal year ended March 31, 2017, we received $78.8 million in proceeds from repayments and sales, invested $54.4 million in two new portfolio company, and extended $16.8 million of follow-on investments to existing portfolio companies through revolver draws, term loans, preferred equity, and common equity. From our initial public offering in June 2005 through March 31, 2017, we have made investments in 45 companies, excluding investments in syndicated loans, for a total of approximately $914 million before giving effect to principal repayments and divestitures
Investment Activity
During the fiscal year ended March 31, 2017, the following significant transactions occurred:
| • | In April 2016, we sold our investment in Acme Cryogenics, Inc. (“Acme”), which resulted in dividend income of $2.8 million and a net realized gain of $18.8 million. In connection with the sale, we received net cash proceeds of $44.6 million, including the repayment of our debt investment of $14.5 million at par and net receivables of $0.6 million, which were recorded within Other assets, net. |
| • | In May 2016, we invested $25.5 million in The Mountain Corporation (“The Mountain”) through a combination of secured second lien debt and preferred equity. The Mountain, headquartered in Keene, New Hampshire, is a designer and manufacturer of premium quality, bold artwear apparel serving a diverse global customer base. |
| • | In October 2016, we restructured our investment in D.P.M.S., Inc (“Danco”). As a result of the restructure, we exchanged existing debt with a cost basis of $16.5 million for a new $8.8 million secured first lien term loan, relinquished our preferred equity with a cost basis of $2.5 million, and relinquished a portion of our common equity with a total cost basis of $3. The transaction resulted in a realized loss of $10.2 million. |
| • | In December 2016, we sold our investment in Behrens Manufacturing, LLC (“Behrens”), which resulted in success fee income of $0.9 million and a net realized gain of $5.8 million. In connection with the sale, we received net cash proceeds of $19.2 million, including the repayment of our debt investment of $10.0 million at par. |
| • | In February 2017, our $5.0 million investment in Auto Safety House, LLC was repaid at par plus $0.5 million of success fee income. |
| • | In February 2017, we invested $28.9 million in JR Hobbs Co. – Atlanta, LLC (“JR Hobbs”) through a combination of secured first lien debt and preferred equity. JR Hobbs, headquartered in Lawrenceville, Georgia, is an HVAC installation subcontractor focused on the multifamily and light commercial construction market in the Southeast U.S. |
The following significant investment activity occurred subsequent to March 31, 2017. Also refer to Note 15 — Subsequent Events in our accompanying Consolidated Financial Statements included elsewhere in this Annual Report on Form 10-K.
| • | In April 2017, we sold our investment in Mitchell Rubber Products, Inc. (“Mitchell”), which had a cost basis and fair value of $16.4 million and $19.2 million, respectively, as of March 31, 2017. In connection with the sale, we received net cash proceeds of $19.0 million, including the repayment of our debt investment of $13.6 million at par. |
41
Recent Developments
Common stock offering
In May 2017, we completed a public offering of 2.1 million shares of our common stock at a public offering price of $9.38 per share, which was below our then current estimated NAV of $9.95 per share. Gross proceeds totaled $19.7 million and net proceeds, after deducting underwriting discounts and commissions and estimated offering costs borne by us, were $18.6 million, which was used to repay borrowings under the Credit Facility and other general corporate purposes. The underwriters also have a 30-day option expiring on June 8, 2017 to purchase up to 315,000 additional shares of common stock on the same terms and conditions solely to cover over-allotments, if any.
Distributions and Dividends
In April 2017, our Board of Directors declared the following monthly and supplemental distributions to common stockholders and monthly dividends to holders of our Series B Term Preferred Stock, Series C Term Preferred Stock, and Series D Term Preferred Stock:
| Record Date |
Payment Date |
Distribution per Common Share |
Dividend per Series B |
Dividend per Series C |
Dividend per Series D | |||||||
| April 21, 2017 |
April 28, 2017 | $0.064 | $0.140625 | $0.135417 | $0.13020833 | |||||||
| May 19, 2017 |
May 31, 2017 | 0.064 | 0.140625 | 0.135417 | 0.13020833 | |||||||
| June 5, 2017 |
June 15, 2017 | 0.060 | (A) | — | — | — | ||||||
| June 21, 2017 |
June 30, 2017 | 0.064 | 0.140625 | 0.135417 | 0.13020833 | |||||||
|
|
|
|
|
| ||||||||
| Total for the Quarter: |
$0.252 | $0.421875 | $0.406251 | $0.39062499 | ||||||||
|
|
|
|
|
| ||||||||
| (A) | Denotes supplemental distribution to common stockholders. |
42
RESULTS OF OPERATIONS
Comparison of the Fiscal Year Ended March 31, 2017, to the Fiscal Year Ended March 31, 2016
| For the Fiscal Years Ended March 31, | ||||||||||||||||
| 2017 | 2016 | $ Change | % Change | |||||||||||||
| INVESTMENT INCOME |
||||||||||||||||
| Interest income |
$ | 46,147 | $ | 46,397 | $ | (250 | ) | (0.5 | )% | |||||||
| Other income |
5,728 | 4,558 | 1,170 | 25.7 | ||||||||||||
|
|
|
|
|
|
|
|
|
|||||||||
| Total investment income |
51,875 | 50,955 | 920 | 1.8 | ||||||||||||
|
|
|
|
|
|
|
|
|
|||||||||
| EXPENSES |
||||||||||||||||
| Base management fee |
9,925 | 9,925 | — | — | ||||||||||||
| Loan servicing fee |
6,606 | 6,697 | (91 | ) | (1.4 | ) | ||||||||||
| Incentive fee |
4,750 | 5,179 | (429 | ) | (8.3 | ) | ||||||||||
| Administration fee |
1,120 | 1,190 | (70 | ) | (5.9 | ) | ||||||||||
| Interest and dividend expense |
12,223 | 12,117 | 106 | 0.9 | ||||||||||||
| Amortization of deferred financing costs and discounts |
1,875 | 1,908 | (33 | ) | (1.7 | ) | ||||||||||
| Other |
3,066 | 3,046 | 20 | 0.7 | ||||||||||||
|
|
|
|
|
|
|
|
|
|||||||||
| Expenses before credits from Adviser |
39,565 | 40,062 | (497 | ) | (1.2 | ) | ||||||||||
| Credits to fees from Adviser |
(10,112 | ) | (9,823 | ) | (289 | ) | 2.9 | |||||||||
|
|
|
|
|
|
|
|
|
|||||||||
| Total expenses, net of credits to fees |
29,453 | 30,239 | (786 | ) | (2.6 | ) | ||||||||||
|
|
|
|
|
|
|
|
|
|||||||||
| NET INVESTMENT INCOME |
22,422 | 20,716 | 1,706 | 8.2 | ||||||||||||
|
|
|
|
|
|
|
|
|
|||||||||
| REALIZED AND UNREALIZED GAIN (LOSS) |
||||||||||||||||
| Net realized gain (loss) on investments |
15,641 | (4,599 | ) | 20,240 | NM | |||||||||||
| Net realized loss on other |
(254 | ) | — | (254 | ) | NM | ||||||||||
| Net unrealized appreciation of investments |
6,879 | 8,737 | (1,858 | ) | (21.3 | ) | ||||||||||
| Net unrealized appreciation of other |
75 | — | 75 | NM | ||||||||||||
|
|
|
|
|
|
|
|
|
|||||||||
| Net realized and unrealized gain |
22,341 | 4,138 | 18,203 | 439.9 | ||||||||||||
|
|
|
|
|
|
|
|
|
|||||||||
| NET INCREASE IN NET ASSETS RESULTING FROM OPERATIONS |
$ | 44,763 | $ | 24,854 | $ | 19,909 | 80.1 | |||||||||
|
|
|
|
|
|
|
|
|
|||||||||
| BASIC AND DILUTED PER COMMON SHARE: |
||||||||||||||||
| Net investment income |
$ | 0.74 | $ | 0.68 | $ | 0.06 | 8.8 | % | ||||||||
|
|
|
|
|
|
|
|
|
|||||||||
| Net increase in net assets resulting from operations |
1.48 | 0.82 | 0.66 | 80.5 | ||||||||||||
|
|
|
|
|
|
|
|
|
|||||||||
NM = Not Meaningful
Investment Income
Total investment income increased by 1.8% for the year ended March 31, 2017, as compared to the prior year. This increase was due to an increase in other income, partially offset by a slight decline in interest income for the same period, which resulted primarily from a small decrease in the size of our interest-bearing portfolio during the year ended March 31, 2017.
Other income for the year ended March 31, 2017 increased 25.7% from the prior year. During the year ended March 31, 2017, other income primarily consisted of $3.3 million of dividend income and $2.4 million of success fee income. During the year ended March 31, 2016, other income primarily consisted of $2.9 million of dividend income and $1.6 million of success fee income.
Interest income from our investments in debt securities remained relatively flat for the year ended March 31, 2017, as compared to the prior year. The level of interest income from investments is directly related to the principal balance of our interest-bearing investment portfolio outstanding during the period multiplied by the weighted average yield. The weighted average principal balance of our interest-bearing investment portfolio during the year ended March 31, 2017, was $364.7 million, compared to $367.6 million for the prior year. This slight decrease was primarily due to the pay-off or restructure of $48.4 million of debt investments principally related to the exit or restructure of portfolio companies, and to $41.6 million in new debt investments and $15.5 million in follow-on debt investments to existing portfolio companies originated after March 31, 2016, and their respective impact on the weighted average principal balance when considering timing of new investments, pay-offs, and restructures, as applicable. The weighted average yield
43
on our interest-bearing investments, excluding cash and cash equivalents and receipts recorded as other income, was 12.7% and 12.6% for the year ended March 31, 2017 and 2016, respectively. The weighted average yield may vary from period to period, based on the current stated interest rate on interest-bearing investments.
At March 31, 2017 and 2016, certain of our loans to two portfolio companies, Alloy Die Casting Co. (“ADC”) and Tread Corporation (“Tread”), were on non-accrual status, with an aggregate debt cost basis of $15.6 million. At March 31, 2016, our loan to Tread was on non-accrual status, with an aggregate debt cost basis of $1.4 million.
The following table lists the investment income for our five largest portfolio company investments, at fair value, during the respective fiscal years:
| As of March 31, 2017 | Year Ended March 31, 2017 | |||||||||||||||
| Company |
Fair Value | % of Portfolio |
Investment Income |
% of Total Investment Income |
||||||||||||
| J.R. Hobbs Co. – Atlanta, LLC(A) |
$ | 29,870 | 6.0 | % | $ | 359 | 0.7 | % | ||||||||
| Counsel Press, Inc. |
29,617 | 5.9 | 3,118 | 6.0 | ||||||||||||
| Cambridge Sound Management, Inc. |
27,046 | 5.4 | 2,065 | 4.0 | ||||||||||||
| Nth Degree, Inc. |
25,761 | 5.1 | 1,684 | 3.2 | ||||||||||||
| Drew Foam Companies, Inc. |
25,242 | 5.0 | 1,666 | 3.2 | ||||||||||||
|
|
|
|
|
|
|
|
|
|||||||||
| Subtotal — five largest investments |
137,536 | 27.4 | 8,892 | 17.1 | ||||||||||||
| Other portfolio companies |
364,043 | 72.6 | 42,983 | 82.9 | ||||||||||||
|
|
|
|
|
|
|
|
|
|||||||||
| Total investment portfolio |
$ | 501,579 | 100.0 | % | $ | 51,875 | 100.0 | % | ||||||||
|
|
|
|
|
|
|
|
|
|||||||||
| As of March 31, 2016 | Year Ended March 31, 2016 | |||||||||||||||
| Company |
Fair Value | % of Portfolio |
Investment Income |
% of Total Investment Income |
||||||||||||
| Acme Cryogenics, Inc.(B) |
$ | 44,894 | 9.2 | % | $ | 1,695 | 3.3 | % | ||||||||
| Counsel Press, Inc. |
28,899 | 5.9 | 3,183 | 6.3 | ||||||||||||
| Cambridge Sound Management, Inc. |
27,835 | 5.7 | 1,983 | 3.9 | ||||||||||||
| SOG Specialty Knives & Tools, LLC |
26,147 | 5.4 | 2,665 | 5.2 | ||||||||||||
| Nth Degree, Inc.(A) |
21,002 | 4.3 | 503 | 1.0 | ||||||||||||
|
|
|
|
|
|
|
|
|
|||||||||
| Subtotal — five largest investments |
148,777 | 30.5 | 10,029 | 19.7 | ||||||||||||
| Other portfolio companies |
338,879 | 69.5 | 40,926 | 80.3 | ||||||||||||
|
|
|
|
|
|
|
|
|
|||||||||
| Total investment portfolio |
$ | 487,656 | 100.0 | % | $ | 50,955 | 100.0 | % | ||||||||
|
|
|
|
|
|
|
|
|
|||||||||
| (A) | New investment during the applicable year. |
| (B) | Investment exited subsequent to March 31, 2016. |
Expenses
Total expenses, net of any non-contractual, unconditional, and irrevocable credits from the Adviser, decreased 2.6% for the year ended March 31, 2017, as compared to the prior year, primarily due to a decrease in the incentive fee. The incentive fee decreased as a result of an increase in net assets, which drives the hurdle rate, period over period.
44
The base management fee, loan servicing fee, incentive fee, and their related non-contractual, unconditional, and irrevocable credits are computed quarterly, as described under “Transactions with the Adviser” in Note 4 — Related Party Transactions of the notes to our accompanying Consolidated Financial Statements and are summarized in the following table:
| Year Ended March 31, | ||||||||
| 2017 | 2016 | |||||||
| Average total assets subject to base management fee(A) |
$ | 496,250 | $ | 496,250 | ||||
| Multiplied by annual base management fee of 2.0% |
2.0 | % | 2.0 | % | ||||
|
|
|
|
|
|||||
| Base management fee(B) |
9,925 | 9,925 | ||||||
| Credits to fees from Adviser — other(B) |
(3,506 | ) | (3,126 | ) | ||||
|
|
|
|
|
|||||
| Net base management fee |
$ | 6,419 | $ | 6,799 | ||||
|
|
|
|
|
|||||
| Loan servicing fee(B) |
6,606 | 6,697 | ||||||
| Credits to base management fee — loan servicing fee(B) |
(6,606 | ) | (6,697 | ) | ||||
|
|
|
|
|
|||||
| Net loan servicing fee |
$ | — | $ | — | ||||
|
|
|
|
|
|||||
| Incentive fee(B) |
4,750 | 5,179 | ||||||
| Credits to fees from Adviser — other(B) |
— | — | ||||||
|
|
|
|
|
|||||
| Net incentive fee |
$ | 4,750 | $ | 5,179 | ||||
|
|
|
|
|
|||||
| (A) | Average total assets subject to the base management fee is defined as total assets, including investments made with proceeds of borrowings, less any uninvested cash or cash equivalents resulting from borrowings, valued at the end of the applicable quarters within the respective periods and adjusted appropriately for any share issuances or repurchases during the periods. |
| (B) | Reflected as a line item on our accompanying Consolidated Statement of Operations. |
Realized and Unrealized Gain (Loss)
Net Realized Gain (Loss) on Investments
During the year ended March 31, 2017, we recorded a net realized gain on investments of $15.6 million, primarily related to a $18.9 million realized gain from the exit of Acme, a $5.9 million realized gain from the exit of Behrens, and a $1.3 million realized gain related to an additional earn-out from Funko, LLC (“Funko”), which was exited in the prior year, partially offset by a $10.2 million realized loss from the restructure of Danco. During the year ended March 31, 2016, we recorded a net realized loss of $4.6 million, primarily related to realized losses of $10.5 million, $2.8 million, and $8.6 million related to the restructuring of our investments in Galaxy Tool Holding Corporation (“Galaxy”), NDLI, Inc. (“NDLI”), and Tread, respectively, partially offset by a realized gain of $17.0 million related to the sale of our investments in Funko and $0.3 million of other gains.
Net Realized Loss on Other
During the year ended March 31, 2017, we recorded a net realized loss on other of $0.3 million, of which $0.2 million related to the redemption of our Series A Term Preferred Stock in September 2016 and $0.1 million related to the expiration of our interest rate cap agreement in April 2016. There were no realized gains or losses on other during the year ended March 31, 2016.
45
Net Unrealized Appreciation of Investments
During the year ended March 31, 2017, we recorded net unrealized appreciation of investments of $6.9 million. The realized gains (losses) and unrealized appreciation (depreciation) across our investments for the year ended March 31, 2017, were as follows:
| Year Ended March 31, 2017 | ||||||||||||||||
| Portfolio Company |
Realized Gain (Loss) |
Unrealized Appreciation (Depreciation) |
Reversal of Unrealized (Appreciation) Depreciation |
Net Gain (Loss) |
||||||||||||
| Mitchell Rubber Products, Inc. |
$ | — | $ | 14,079 | $ | — | $ | 14,079 | ||||||||
| Logo Sportswear, Inc. |
— | 8,375 | — | 8,375 | ||||||||||||
| Galaxy Tool Holding Corporation |
— | 6,242 | — | 6,242 | ||||||||||||
| Brunswick Bowling Products, Inc. |
— | 6,062 | — | 6,062 | ||||||||||||
| Head Country, Inc. |
— | 5,752 | — | 5,752 | ||||||||||||
| Drew Foam Companies, Inc. |
— | 5,287 | — | 5,287 | ||||||||||||
| Nth Degree, Inc. |
— | 4,760 | — | 4,760 | ||||||||||||
| Old World Christmas, Inc. |
— | 2,975 | — | 2,975 | ||||||||||||
| Ginsey Home Solutions, Inc. |
— | 2,362 | — | 2,362 | ||||||||||||
| Meridian Rack & Pinion, Inc. |
— | 1,757 | — | 1,757 | ||||||||||||
| Edge Adhesives Holdings, Inc. |
— | 1,628 | — | 1,628 | ||||||||||||
| Funko Acquisition Holdings, LLC |
1,087 | 36 | — | 1,123 | ||||||||||||
| Diligent Delivery Systems |
— | 907 | — | 907 | ||||||||||||
| Counsel Press, Inc. |
— | 717 | — | 717 | ||||||||||||
| Behrens Manufacturing, LLC |
5,935 | 1,820 | (7,491 | ) | 264 | |||||||||||
| Auto Safety House, LLC |
— | 146 | (457 | ) | (311 | ) | ||||||||||
| SBS Industries, LLC |
— | (794 | ) | — | (794 | ) | ||||||||||
| Frontier Packaging, Inc. |
— | (843 | ) | — | (843 | ) | ||||||||||
| AquaVenture Holdings Limited |
— | (925 | ) | — | (925 | ) | ||||||||||
| B-Dry, LLC |
— | (987 | ) | — | (987 | ) | ||||||||||
| D.P.M.S., Inc. |
(10,226 | ) | (3,848 | ) | 12,601 | (1,473 | ) | |||||||||
| Tread Corporation |
— | (1,737 | ) | — | (1,737 | ) | ||||||||||
| Cambridge Sound Management, Inc. |
— | (1,789 | ) | — | (1,789 | ) | ||||||||||
| Mathey Investments, Inc. |
— | (1,934 | ) | — | (1,934 | ) | ||||||||||
| Jackrabbit, Inc. |
— | (1,984 | ) | — | (1,984 | ) | ||||||||||
| Acme Cryogenics, Inc. |
18,904 | — | (21,216 | ) | (2,312 | ) | ||||||||||
| Alloy Die Casting Co. |
— | (3,283 | ) | — | (3,283 | ) | ||||||||||
| Schylling, Inc. |
— | (3,842 | ) | — | (3,842 | ) | ||||||||||
| Precision Southeast, Inc. |
— | (3,922 | ) | — | (3,922 | ) | ||||||||||
| The Mountain Corporation |
— | (6,747 | ) | — | (6,747 | ) | ||||||||||
| SOG Specialty Knives & Tools, LLC |
— | (7,036 | ) | — | (7,036 | ) | ||||||||||
| Other, net (<$250 Net) |
(59 | ) | 208 | — | 149 | |||||||||||
|
|
|
|
|
|
|
|
|
|||||||||
| Total |
$ | 15,641 | $ | 23,442 | $ | (16,563 | ) | $ | 22,520 | |||||||
|
|
|
|
|
|
|
|
|
|||||||||
The primary drivers of net unrealized appreciation of investments of $6.9 million for the year ended March 31, 2017, was the reversal of previously recorded unrealized depreciation related to our investment in Danco upon its restructure, an increase in the fair value of our investment in Mitchell based on its sale in April 2017, and increased performance and comparable multiples used to estimate the fair value of certain of our investments, which was partially offset by unrealized depreciation resulting from the reversal of previously recorded unrealized appreciation related to the exit of our investments in Acme and Behrens and a decrease in performance of certain of our portfolio companies.
46
During the year ended March 31, 2016, we recorded net unrealized appreciation of investments of $8.7 million. The realized gains (losses) and unrealized appreciation (depreciation) across our investments for the year ended March 31, 2016 were as follows:
| Year Ended March 31, 2016 | ||||||||||||||||
| Portfolio Company |
Realized Gain (Loss) |
Unrealized Appreciation (Depreciation) |
Reversal of Unrealized (Appreciation) Depreciation |
Net Gain (Loss) |
||||||||||||
| Acme Cryogenics, Inc. |
$ | — | $ | 21,875 | $ | — | $ | 21,875 | ||||||||
| Cambridge Sound Management, Inc. |
— | 5,636 | — | 5,636 | ||||||||||||
| D.P.M.S., Inc. |
— | 5,503 | — | 5,503 | ||||||||||||
| Frontier Packaging, Inc. |
— | 5,426 | — | 5,426 | ||||||||||||
| Behrens Manufacturing, LLC |
— | 5,147 | — | 5,147 | ||||||||||||
| Schylling, Inc. |
— | 4,103 | — | 4,103 | ||||||||||||
| Drew Foam Companies, Inc. |
— | 3,697 | — | 3,697 | ||||||||||||
| Funko, LLC |
17,039 | 1,861 | (16,009 | ) | 2,891 | |||||||||||
| Country Club Enterprises, LLC |
— | 2,450 | — | 2,450 | ||||||||||||
| Precision Southeast, Inc. |
— | 2,092 | — | 2,092 | ||||||||||||
| Nth Degree, Inc. |
— | 2,052 | — | 2,052 | ||||||||||||
| Diligent Delivery Systems |
— | 1,484 | — | 1,484 | ||||||||||||
| Logo Sportswear, Inc. |
— | 1,245 | — | 1,245 | ||||||||||||
| Tread Corporation |
(8,628 | ) | 3,603 | 6,086 | 1,061 | |||||||||||
| NDLI, Inc. |
(2,795 | ) | (50 | ) | 3,480 | 635 | ||||||||||
| GI Plastek, Inc. |
— | 522 | — | 522 | ||||||||||||
| Auto Safety House, LLC |
— | 373 | — | 373 | ||||||||||||
| Brunswick Bowling Products, Inc. |
— | 324 | — | 324 | ||||||||||||
| Star Seed, Inc. |
— | (300 | ) | — | (300 | ) | ||||||||||
| Quench Holdings Corp. |
— | (1,072 | ) | — | (1,072 | ) | ||||||||||
| Jackrabbit, Inc. |
— | (1,133 | ) | — | (1,133 | ) | ||||||||||
| Channel Technologies Group, LLC |
— | (1,401 | ) | — | (1,401 | ) | ||||||||||
| Cavert II Holding Corp. |
(1 | ) | 63 | (1,483 | ) | (1,421 | ) | |||||||||
| Counsel Press Inc. |
— | (1,596 | ) | — | (1,596 | ) | ||||||||||
| B-Dry, LLC |
— | (2,069 | ) | — | (2,069 | ) | ||||||||||
| Ginsey Home Solutions, Inc. |
— | (2,362 | ) | — | (2,362 | ) | ||||||||||
| Mitchell Rubber Products, Inc. |
— | (3,154 | ) | 700 | (2,454 | ) | ||||||||||
| Old World Christmas, Inc. |
— | (2,498 | ) | — | (2,498 | ) | ||||||||||
| SBS Industries, LLC |
— | (2,810 | ) | — | (2,810 | ) | ||||||||||
| Meridian Rack & Pinion, Inc. |
— | (2,950 | ) | — | (2,950 | ) | ||||||||||
| Head Country Food Products, Inc. |
— | (3,931 | ) | — | (3,931 | ) | ||||||||||
| Edge Adhesives Holdings, Inc. |
— | (3,971 | ) | 9 | (3,962 | ) | ||||||||||
| Alloy Die Casting Co. |
— | (4,274 | ) | — | (4,274 | ) | ||||||||||
| B+T Group Acquisition, Inc. |
— | (4,541 | ) | — | (4,541 | ) | ||||||||||
| SOG Specialty Knives & Tools, LLC |
— | (5,704 | ) | — | (5,704 | ) | ||||||||||
| Mathey Investments, Inc. |
— | (7,576 | ) | — | (7,576 | ) | ||||||||||
| Galaxy Tool Holding Corporation |
(10,545 | ) | (2,762 | ) | 2,762 | (10,545 | ) | |||||||||
| Other, net (<$250 Net) |
331 | — | (110 | ) | 221 | |||||||||||
|
|
|
|
|
|
|
|
|
|||||||||
| Total |
$ | (4,599 | ) | $ | 13,302 | $ | (4,565 | ) | $ | 4,138 | ||||||
|
|
|
|
|
|
|
|
|
|||||||||
The primary drivers of net unrealized appreciation of investments of $8.7 million for the year ended March 31, 2016, was an increase in the equity valuation of Acme due to an increase in performance and comparable multiples used to estimate the fair value of our investment, as well as an increase in performance and, to a lesser extent, multiples used to estimate the fair value of certain of our other investments and the reversal of previously recorded unrealized depreciation on our investments in Galaxy, NDLI, and Tread upon their restructures. These increases were partially offset by the reversal of previously recorded unrealized appreciation on our investments in Cavert II Holding Corp. (“Cavert”) and Funko upon their exits as well as a decline in the performance of certain portfolio companies.
Across our entire investment portfolio, we recorded $10.0 million of net unrealized appreciation on our debt positions and $3.1 million of net unrealized depreciation on our equity holdings for the year ended March 31, 2017. At March 31, 2017, the fair value of our investment portfolio was less than our cost basis by $23.6 million, as compared to $30.5 million at March 31, 2016, representing net unrealized appreciation of $6.9 million for the year ended March 31, 2017. Our entire portfolio was fair valued at 95.5% of cost as of March 31, 2017.
47
Net Unrealized Appreciation on Other
For the year ended March 31, 2017, we recorded net unrealized appreciation on other of $75 due to the reversal of previously recorded depreciation upon the expiration of our interest rate cap agreement in April 2016. For the year ended March 31, 2016, no such amounts were incurred.
48
Comparison of the Fiscal Year Ended March 31, 2016, to the Fiscal Year Ended March 31, 2015
| For the Fiscal Years Ended March 31, | ||||||||||||||||
| 2016 | 2015 | $ Change | % Change | |||||||||||||
| INVESTMENT INCOME |
||||||||||||||||
| Interest income |
$ | 46,397 | $ | 36,685 | $ | 9,712 | 26.5 | % | ||||||||
| Other income |
4,558 | 4,958 | (400 | ) | (8.1 | ) | ||||||||||
|
|
|
|
|
|
|
|
|
|||||||||
| Total investment income |
50,955 | 41,643 | 9,312 | 22.4 | ||||||||||||
|
|
|
|
|
|
|
|
|
|||||||||
| EXPENSES |
||||||||||||||||
| Base management fee |
9,925 | 7,569 | 2,356 | 31.1 | ||||||||||||
| Loan servicing fee |
6,697 | 4,994 | 1,703 | 34.1 | ||||||||||||
| Incentive fee |
5,179 | 4,975 | 204 | 4.1 | ||||||||||||
| Administration fee |
1,190 | 932 | 258 | 27.7 | ||||||||||||
| Interest and dividend expense |
12,117 | 7,460 | 4,657 | 62.4 | ||||||||||||
| Amortization of deferred financing costs |
1,908 | 1,329 | 579 | 43.6 | ||||||||||||
| Other |
3,046 | 2,329 | 717 | 30.8 | ||||||||||||
|
|
|
|
|
|
|
|
|
|||||||||
| Expenses before credits from Adviser |
40,062 | 29,588 | 10,474 | 35.4 | ||||||||||||
| Credits to fees from Adviser |
(9,823 | ) | (7,842 | ) | (1,981 | ) | 25.3 | |||||||||
|
|
|
|
|
|
|
|
|
|||||||||
| Total expenses, net of credits to fees |
30,239 | 21,746 | 8,493 | 39.1 | ||||||||||||
|
|
|
|
|
|
|
|
|
|||||||||
| NET INVESTMENT INCOME |
20,716 | 19,897 | 819 | 4.1 | ||||||||||||
|
|
|
|
|
|
|
|
|
|||||||||
| REALIZED AND UNREALIZED GAIN (LOSS) |
||||||||||||||||
| Net realized loss on investments |
(4,599 | ) | (73 | ) | (4,526 | ) | NM | |||||||||
| Net unrealized appreciation of investments |
8,737 | 29,940 | (21,203 | ) | (70.8 | ) | ||||||||||
| Net unrealized depreciation of other |
— | 450 | (450 | ) | (100.0 | ) | ||||||||||
|
|
|
|
|
|
|
|
|
|||||||||
| Net realized and unrealized gain |
4,138 | 30,317 | (26,179 | ) | (86.4 | ) | ||||||||||
|
|
|
|
|
|
|
|
|
|||||||||
| NET INCREASE IN NET ASSETS RESULTING FROM OPERATIONS |
$ | 24,854 | $ | 50,214 | $ | (25,360 | ) | (50.5 | ) | |||||||
|
|
|
|
|
|
|
|
|
|||||||||
| BASIC AND DILUTED PER COMMON SHARE: |
||||||||||||||||
| Net investment income |
$ | 0.68 | $ | 0.75 | $ | (0.07 | ) | (9.3 | )% | |||||||
|
|
|
|
|
|
|
|
|
|||||||||
| Net increase in net assets resulting from operations |
0.82 | 1.88 | (1.06 | ) | (56.4 | ) | ||||||||||
|
|
|
|
|
|
|
|
|
|||||||||
NM = Not Meaningful
Investment Income
Total investment income increased by 22.4% for the year ended March 31, 2016, as compared to the prior year. This increase was due to an increase in interest income, which resulted primarily from an increase in the size of our interest-bearing portfolio during the year ended March 31, 2016, partially offset by a decline in other income for the same period.
Interest income from our investments in debt securities increased 26.5% for the year ended March 31, 2016, as compared to the prior year. The level of interest income from investments is directly related to the principal balance of our interest-bearing investment portfolio outstanding during the period multiplied by the weighted average yield. The weighted average principal balance of our interest-bearing investment portfolio during the year ended March 31, 2016, was $367.6 million, compared to $292.2 million for the prior year. This increase was primarily due to $53.4 million in new debt investments originated after March 31, 2015. The weighted average yield on our interest-bearing investments, excluding cash and cash equivalents and receipts recorded as other income, was 12.6% for both years ended March 31, 2016 and 2015. The weighted average yield may vary from period to period, based on the current stated interest rate on interest-bearing investments.
Our loans to one portfolio company, Tread, were on non-accrual status as of March 31, 2016 and 2015, with an aggregate debt cost basis of $1.4 million and $11.7 million, respectively.
49
Other income for the year ended March 31, 2016 decreased 8.1% from the prior year. During the year ended March 31, 2016, other income primarily consisted of $2.9 million of dividend income and $1.6 million of success fee income. During the year ended March 31, 2015, other income primarily consisted of $3.5 million of dividend income and $1.4 million of success fee income.
The following table lists the investment income for our five largest portfolio company investments, at fair value, during the respective fiscal years:
| As of March 31, 2016 | Year Ended March 31, 2016 | |||||||||||||||
| Company |
Fair Value | % of Portfolio |
Investment Income |
% of Total Investment Income |
||||||||||||
| Acme Cryogenics, Inc.(A) |
$ | 44,894 | 9.2 | % | $ | 1,695 | 3.3 | % | ||||||||
| Counsel Press, Inc. |
28,899 | 5.9 | 3,183 | 6.3 | ||||||||||||
| Cambridge Sound Management, Inc. |
27,835 | 5.7 | 1,983 | 3.9 | ||||||||||||
| SOG Specialty Knives & Tools, LLC |
26,147 | 5.4 | 2,665 | 5.2 | ||||||||||||
| Nth Degree, Inc. (B) |
21,002 | 4.3 | 503 | 1.0 | ||||||||||||
|
|
|
|
|
|
|
|
|
|||||||||
| Subtotal — five largest investments |
148,777 | 30.5 | 10,029 | 19.7 | ||||||||||||
| Other portfolio companies |
338,879 | 69.5 | 40,926 | 80.3 | ||||||||||||
|
|
|
|
|
|
|
|
|
|||||||||
| Total investment portfolio |
$ | 487,656 | 100.0 | % | $ | 50,955 | 100.0 | % | ||||||||
|
|
|
|
|
|
|
|
|
|||||||||
| As of March 31, 2015 | Year Ended March 31, 2015 | |||||||||||||||
| Company |
Fair Value | % of Portfolio |
Investment Income |
% of Total Investment Income |
||||||||||||
| Counsel Press, Inc.(B) |
$ | 31,995 | 6.9 | % | $ | 9 | 0.0 | % | ||||||||
| SOG Specialty Knives & Tools, LLC |
31,851 | 6.8 | 2,657 | 6.4 | ||||||||||||
| Funko, LLC |
25,008 | 5.4 | 991 | 2.4 | ||||||||||||
| Acme Cryogenics, Inc. |
23,019 | 4.9 | 1,691 | 4.1 | ||||||||||||
| Old World Christmas, Inc.(B) |
22,427 | 4.8 | 1,060 | 2.5 | ||||||||||||
|
|
|
|
|
|
|
|
|
|||||||||
| Subtotal — five largest investments |
134,300 | 28.8 | 6,408 | 15.4 | ||||||||||||
| Other portfolio companies |
331,753 | 71.2 | 35,235 | 84.6 | ||||||||||||
|
|
|
|
|
|
|
|
|
|||||||||
| Total investment portfolio |
$ | 466,053 | 100.0 | % | $ | 41,643 | 100.0 | % | ||||||||
|
|
|
|
|
|
|
|
|
|||||||||
| (A) | Investment exited subsequent to March 31, 2016. |
| (B) | New investment during the applicable year. |
Expenses
Total expenses, net of any non-contractual, unconditional, and irrevocable credits from the Adviser, increased 39.1% for the year ended March 31, 2016, as compared to the prior year period, primarily due to an increase in interest and dividend expense and in the net base management fee.
50
The net base management fee increased for the fiscal year ended March 31, 2016, as compared to the prior year, as a result of the increased size of our portfolio over the respective periods. The base management fee, loan servicing fee, incentive fee, and their related non-contractual, unconditional, and irrevocable credits are computed quarterly, as described under “Transactions with the Adviser” in Note 4 — Related Party Transactions of the notes to our accompanying Consolidated Financial Statements and are summarized in the following table:
| Year Ended March 31, | ||||||||
| 2016 | 2015 | |||||||
| Average total assets subject to base management fee(A) |
$ | 496,250 | $ | 378,450 | ||||
| Multiplied by annual base management fee of 2.0% |
2.0 | % | 2.0 | % | ||||
|
|
|
|
|
|||||
| Base management fee(B) |
9,925 | 7,569 | ||||||
| Credits to fees from Adviser — other(B) |
(3,126 | ) | (2,848 | ) | ||||
|
|
|
|
|
|||||
| Net base management fee |
$ | 6,799 | $ | 4,721 | ||||
|
|
|
|
|
|||||
| Loan servicing fee(B) |
6,697 | 4,994 | ||||||
| Credits to base management fee — loan servicing fee(B) |
(6,697 | ) | (4,994 | ) | ||||
|
|
|
|
|
|||||
| Net loan servicing fee |
$ | — | $ | — | ||||
|
|
|
|
|
|||||
| Incentive fee(B) |
5,179 | 4,975 | ||||||
| Credits to fees from Adviser — other(B) |
— | — | ||||||
|
|
|
|
|
|||||
| Net incentive fee |
$ | 5,179 | $ | 4,975 | ||||
|
|
|
|
|
|||||
| (A) | Average total assets subject to the base management fee is defined as total assets, including investments made with proceeds of borrowings, less any uninvested cash or cash equivalents resulting from borrowings, valued at the end of the applicable quarters within the respective periods and adjusted appropriately for any share issuances or repurchases during the periods. |
| (B) | Reflected as a line item on our accompanying Consolidated Statement of Operations. |
Interest and dividend expense increased 62.4% for the year ended March 31, 2016, as compared to the prior year, primarily due to increased average borrowings under the Credit Facility and the issuance of our Series B Term Preferred Stock in November 2014 and our Series C Term Preferred Stock in May 2015. The weighted average balance outstanding on the Credit Facility during the fiscal year ended March 31, 2016 was $94.6 million, as compared to $79.2 million in the prior year. Dividends on mandatorily redeemable preferred stock increased as a result of the issuance of $41.4 million of our Series B Term Preferred Stock in November 2014 and the issuance of $40.3 million of our Series C Term Preferred Stock in May 2015.
Realized and Unrealized Gain (Loss)
Net Realized Loss on Investments
During the year ended March 31, 2016, we recorded a net realized loss of $4.6 million, primarily consisting of realized losses of $10.5 million, $2.8 million, and $8.6 million related to the restructuring of our investments in Galaxy, NDLI, and Tread, respectively, partially offset by a realized gain of $17.0 million related to the sale of our investments in Funko and $0.3 million of other gains. During the fiscal year ended March 31, 2015, we recorded a net realized loss of $0.1 million related to reversal of escrows from previous investment exits.
51
Net Unrealized Appreciation of Investments
During the year ended March 31, 2016, we recorded net unrealized appreciation of investments of $8.7 million. The realized gains (losses) and unrealized appreciation (depreciation) across our investments for the year ended March 31, 2016, were as follows:
| Year Ended March 31, 2016 | ||||||||||||||||
| Portfolio Company |
Realized Gain (Loss) |
Unrealized Appreciation (Depreciation) |
Reversal of Unrealized (Appreciation) Depreciation |
Net Gain (Loss) |
||||||||||||
| Acme Cryogenics, Inc. |
$ | — | $ | 21,875 | $ | — | $ | 21,875 | ||||||||
| Cambridge Sound Management, Inc. |
— | 5,636 | — | 5,636 | ||||||||||||
| D.P.M.S., Inc. |
— | 5,503 | — | 5,503 | ||||||||||||
| Frontier Packaging, Inc. |
— | 5,426 | — | 5,426 | ||||||||||||
| Behrens Manufacturing, LLC |
— | 5,147 | — | 5,147 | ||||||||||||
| Schylling, Inc. |
— | 4,103 | — | 4,103 | ||||||||||||
| Drew Foam Companies, Inc. |
— | 3,697 | — | 3,697 | ||||||||||||
| Funko, LLC |
17,039 | 1,861 | (16,009 | ) | 2,891 | |||||||||||
| Country Club Enterprises, LLC |
— | 2,450 | — | 2,450 | ||||||||||||
| Precision Southeast, Inc. |
— | 2,092 | — | 2,092 | ||||||||||||
| Nth Degree, Inc. |
— | 2,052 | — | 2,052 | ||||||||||||
| Diligent Delivery Systems |
— | 1,484 | — | 1,484 | ||||||||||||
| Logo Sportswear, Inc. |
— | 1,245 | — | 1,245 | ||||||||||||
| Tread Corporation |
(8,628 | ) | 3,603 | 6,086 | 1,061 | |||||||||||
| NDLI, Inc. |
(2,795 | ) | (50 | ) | 3,480 | 635 | ||||||||||
| GI Plastek, Inc. |
— | 522 | — | 522 | ||||||||||||
| Auto Safety House, LLC |
— | 373 | — | 373 | ||||||||||||
| Brunswick Bowling Products, Inc. |
— | 324 | — | 324 | ||||||||||||
| Star Seed, Inc. |
— | (300 | ) | — | (300 | ) | ||||||||||
| Quench Holdings Corp. |
— | (1,072 | ) | — | (1,072 | ) | ||||||||||
| Jackrabbit, Inc. |
— | (1,133 | ) | — | (1,133 | ) | ||||||||||
| Channel Technologies Group, LLC |
— | (1,401 | ) | — | (1,401 | ) | ||||||||||
| Cavert II Holding Corp. |
(1 | ) | 63 | (1,483 | ) | (1,421 | ) | |||||||||
| Counsel Press Inc. |
— | (1,596 | ) | — | (1,596 | ) | ||||||||||
| B-Dry, LLC |
— | (2,069 | ) | — | (2,069 | ) | ||||||||||
| Ginsey Home Solutions, Inc. |
— | (2,362 | ) | — | (2,362 | ) | ||||||||||
| Mitchell Rubber Products, Inc. |
— | (3,154 | ) | 700 | (2,454 | ) | ||||||||||
| Old World Christmas, Inc. |
— | (2,498 | ) | — | (2,498 | ) | ||||||||||
| SBS Industries, LLC |
— | (2,810 | ) | — | (2,810 | ) | ||||||||||
| Meridian Rack & Pinion, Inc. |
— | (2,950 | ) | — | (2,950 | ) | ||||||||||
| Head Country Food Products, Inc. |
— | (3,931 | ) | — | (3,931 | ) | ||||||||||
| Edge Adhesives Holdings, Inc. |
— | (3,971 | ) | 9 | (3,962 | ) | ||||||||||
| Alloy Die Casting Co. |
— | (4,274 | ) | — | (4,274 | ) | ||||||||||
| B+T Group Acquisition, Inc. |
— | (4,541 | ) | — | (4,541 | ) | ||||||||||
| SOG Specialty Knives & Tools, LLC |
— | (5,704 | ) | — | (5,704 | ) | ||||||||||
| Mathey Investments, Inc. |
— | (7,576 | ) | — | (7,576 | ) | ||||||||||
| Galaxy Tool Holding Corporation |
(10,545 | ) | (2,762 | ) | 2,762 | (10,545 | ) | |||||||||
| Other, net (<$250 Net) |
331 | — | (110 | ) | 221 | |||||||||||
|
|
|
|
|
|
|
|
|
|||||||||
| Total |
$ | (4,599 | ) | $ | 13,302 | $ | (4,565 | ) | $ | 4,138 | ||||||
|
|
|
|
|
|
|
|
|
|||||||||
The primary drivers of net unrealized appreciation of investments of $8.7 million for the year ended March 31, 2016, was an increase in the equity valuation of Acme due to an increase in performance and comparable multiples used to estimate the fair value of our investment, as well as an increase in performance and, to a lesser extent, multiples used to estimate the fair value of certain of our other investments and the reversal of previously recorded unrealized depreciation on our investments in Galaxy, NDLI, and Tread upon their restructures. These increases were partially offset by the reversal of previously recorded unrealized appreciation on our investments in Cavert and Funko upon their exits as well as a decline in the performance of certain portfolio companies.
52
During the year ended March 31, 2015, we recorded net unrealized appreciation of investments of $29.9 million. The realized gains (losses) and unrealized appreciation (depreciation) across our investments for the year ended March 31, 2015, were as follows:
| Year Ended March 31, 2015 | ||||||||||||||||
| Portfolio Company |
Realized Loss |
Unrealized Appreciation (Depreciation) |
Reversal of Unrealized (Appreciation) Depreciation |
Net Gain (Loss) |
||||||||||||
| Funko, LLC |
$ | — | $ | 13,090 | $ | — | $ | 13,090 | ||||||||
| SOG Specialty Knives & Tools, LLC |
— | 5,211 | — | 5,211 | ||||||||||||
| Drew Foam Companies, Inc. |
— | 4,994 | — | 4,994 | ||||||||||||
| Jackrabbit, Inc. |
— | 4,575 | — | 4,575 | ||||||||||||
| NDLI, Inc. |
— | 4,397 | — | 4,397 | ||||||||||||
| Ginsey Home Solutions, Inc. |
— | 3,904 | — | 3,904 | ||||||||||||
| Mathey Investments, Inc. |
— | 2,735 | — | 2,735 | ||||||||||||
| Cambridge Sound Management, Inc. |
— | 2,698 | — | 2,698 | ||||||||||||
| Alloy Die Casting Co. |
— | 2,068 | — | 2,068 | ||||||||||||
| Tread Corporation |
— | 1,896 | — | 1,896 | ||||||||||||
| Frontier Packaging, Inc. |
— | 1,816 | — | 1,816 | ||||||||||||
| SBS Industries, LLC |
— | 1,746 | — | 1,746 | ||||||||||||
| Behrens Manufacturing, LLC |
— | 692 | — | 692 | ||||||||||||
| Old World Christmas, Inc. |
— | 477 | — | 477 | ||||||||||||
| Quench Holdings Corp. |
— | 375 | — | 375 | ||||||||||||
| B+T Group Acquisition, Inc. |
— | 344 | — | 344 | ||||||||||||
| Edge Adhesives Holdings, Inc. |
— | (274 | ) | — | (274 | ) | ||||||||||
| Meridian Rack & Pinion, Inc. |
— | (411 | ) | — | (411 | ) | ||||||||||
| D.P.M.S., Inc. |
— | (605 | ) | — | (605 | ) | ||||||||||
| Country Club Enterprises, LLC |
— | (806 | ) | — | (806 | ) | ||||||||||
| Channel Technologies Group, LLC |
— | (807 | ) | — | (807 | ) | ||||||||||
| Galaxy Tool Holding Corporation |
— | (2,992 | ) | — | (2,992 | ) | ||||||||||
| Acme Cryogenics, Inc. |
— | (3,881 | ) | — | (3,881 | ) | ||||||||||
| B-Dry, LLC |
— | (4,081 | ) | — | (4,081 | ) | ||||||||||
| Mitchell Rubber Products, Inc. |
— | (7,178 | ) | — | (7,178 | ) | ||||||||||
| Other, net (<$250 Net) |
(73 | ) | (43 | ) | — | (116 | ) | |||||||||
|
|
|
|
|
|
|
|
|
|||||||||
| Total |
$ | (73 | ) | $ | 29,940 | $ | — | $ | 29,867 | |||||||
|
|
|
|
|
|
|
|
|
|||||||||
The primary drivers of net unrealized appreciation of investments of $29.9 million for the year ended March 31, 2015, was an increase in the equity valuations of Funko, SOG Specialty Knives & Tools, LLC, Drew Foam, Jackrabbit, Inc., and NDLI, due to an increase in the portfolio companies’ performance and an increase in certain comparable multiples used to estimate the fair value of our investments. This was partially offset by a decline in performance of certain portfolio companies.
Across our entire investment portfolio, we recorded $15.2 million of net unrealized appreciation on our debt positions and $6.5 million of net unrealized depreciation on our equity holdings for the year ended March 31, 2016. At March 31, 2016, the fair value of our investment portfolio was less than our cost basis by $30.5 million, as compared to $39.2 million at March 31, 2015, representing net unrealized appreciation of $8.7 million for the year ended March 31, 2016. Our entire portfolio was fair valued at 94.1% of cost as of March 31, 2016.
Net Unrealized Depreciation on Other
For the year ended March 31, 2015, we recorded $0.5 million of net unrealized depreciation on the Credit Facility recorded at fair value. For the year ended March 31, 2016, no such amounts were incurred.
53
LIQUIDITY AND CAPITAL RESOURCES
Operating Activities
Cash inflows from operating activities are primarily generated from cash collections of interest and other income from our portfolio companies, as well as cash proceeds received from repayments of debt investments and sales of equity investments. These cash collections are principally used to fund new investments, pay distributions to our common stockholders, make interest payments on the Credit Facility, make dividend payments on our mandatorily redeemable preferred stock, pay management and incentive fees to the Adviser, and for other operating expenses. We may also use cash collections from operations to repay outstanding borrowing under the Credit Facility.
Net cash provided by operating activities for the year ended March 31, 2017 was $32.5 million, as compared to $4.1 million for the year ended March 31, 2016. This change was primarily due to an increase in repayments and proceeds from the sale of investments year over year. Repayments and proceeds from the sale of investments totaled $68.8 million during the year ended March 31, 2017 compared to $44.6 million during the year ended March 31, 2016.
Net cash provided by operating activities for the year ended March 31, 2016 was $4.1 million, as compared to net cash used in operating activities of $97.6 million for the year ended March 31, 2015. This change was primarily due to a decrease in the purchase of investments and an increase in repayments and proceeds from the sale of investments year over year. Purchases of investments were $61.9 million during the year ended March 31, 2016 compared to $132.9 million during the year ended March 31, 2015. Repayments and proceeds from the sale of investments totaled $44.6 million during the year ended March 31, 2016 compared to $11.3 million during the year ended March 31, 2015.
As of March 31, 2017, we had equity investments in, or loans to, 35 companies with an aggregate cost basis of $525.2 million. As of March 31, 2016, we had equity investments in, or loans to, 36 companies with an aggregate cost basis of $518.1 million. The following table summarizes our total portfolio investment activity for the years ended March 31, 2017 and 2016:
| Years Ended March 31, | ||||||||
| 2017 | 2016 | |||||||
| Beginning investment portfolio, at fair value |
$ | 487,656 | $ | 466,053 | ||||
| New investments |
54,370 | 55,436 | ||||||
| Disbursements to existing portfolio companies |
8,076 | 6,460 | ||||||
| Scheduled principal repayments |
— | (4,141 | ) | |||||
| Unscheduled principal repayments |
(31,886 | ) | (20,064 | ) | ||||
| Net proceeds from sales of investments |
(36,939 | ) | (20,377 | ) | ||||
| Net realized gain (loss) on investments |
13,423 | (4,448 | ) | |||||
| Net unrealized appreciation of investments |
23,442 | 13,302 | ||||||
| Reversal of net unrealized appreciation of investments |
(16,563 | ) | (4,565 | ) | ||||
|
|
|
|
|
|||||
| Ending investment portfolio, at fair value |
$ | 501,579 | $ | 487,656 | ||||
|
|
|
|
|
|||||
The following table summarizes the contractual principal repayment and maturity of our investment portfolio by fiscal year, assuming no voluntary prepayments, as of March 31, 2017:
| Amount(A) | ||||||
| For the fiscal years ending March 31: |
2018 | $ | 60,640 | |||
| 2019 | 76,941 | |||||
| 2020 | 100,408 | |||||
| 2021 | 75,515 | |||||
| 2022 | 64,397 | |||||
| Thereafter | — | |||||
|
|
|
|||||
| Total contractual repayments | $ | 377,901 | ||||
| Investments in equity securities |
147,268 | |||||
|
|
|
|||||
| Total cost basis of investments held as of March 31, 2017: | $ | 525,169 | ||||
|
|
|
|||||
| (A) | Subsequent to March 31, 2017, one debt investment with a principal balance of $13.6 million maturing during the fiscal year ending March 31, 2018 was repaid at par and debt investments in two portfolio companies with principal balances of $4.0 million and $18.4 million, which previously had maturity dates during the fiscal year ending March 31, 2018, were extended to mature during the fiscal year ending March 31, 2019 and March 31, 2021, respectively. |
54
Financing Activities
Net cash used in financing activities for the year ended March 31, 2017 was $34.1 million, which consisted primarily of $25.3 million of net repayments on the Credit Facility, $22.7 million in distributions to common stockholders, and the redemption of our Series A Term Preferred Stock in September 2016 of $40.0 million, partially offset by net proceeds from the issuance of our Series D Term Preferred Stock of $55.4 million in September 2016. Net cash used in financing activities for the year ended March 31, 2016 was $4.5 million, which consisted primarily of $23.8 million of net repayments on the Credit Facility and $22.7 million of distributions to common stockholders, partially offset by $38.6 million of net proceeds from the issuance of our Series C Term Preferred Stock and $3.4 million of net proceeds from the issuance of additional shares of our common stock. Net cash provided by financing activities for the year ended March 31, 2015, was $97.9 million, which consisted primarily of $39.7 million of net proceeds from the issuance of our Series B Term Preferred Stock, $23.0 million of net proceeds from the issuance of additional shares of our common stock, and $57.5 million of net borrowings on the Credit Facility, partially offset by $20.6 million in distributions to common stockholders.
Distributions and Dividends to Stockholders
Common Stock Distributions
To qualify to be taxed as a RIC and thus avoid corporate level federal income tax on the income we distribute to our stockholders, we are required to distribute to our stockholders on an annual basis at least 90% of our Investment Company Taxable Income. Additionally, the Credit Facility generally restricts the amount of distributions to stockholders that we can pay out to be no greater than the sum of certain amounts, including, but not limited to, our net investment income, plus net capital gains, plus amounts elected by the Company to be considered as having been paid during the prior fiscal year in accordance with Section 855(a) of the Code. In accordance with these requirements, our Board of Directors declared, and we paid, monthly cash distributions of $0.0625 per common share for each month during the year ended March 31, 2017. In April 2017, our Board of Directors declared a monthly distribution of $0.064 per common share for each of April, May, and June 2017 and a supplemental distribution of $0.06 per common share for June 2017. Our Board of Directors declared these distributions based on estimates of taxable income for the fiscal year ending March 31, 2018.
For federal income tax purposes, we determine the tax characterization of our common distributions as of the end of our fiscal year based upon our taxable income for the full fiscal year and distributions paid during the full fiscal year. The characterization of the common stockholder distributions declared and paid for the year ending March 31, 2018 will be determined after the 2018 fiscal year end based upon our taxable income for the full year and distributions paid during the full year. Such a characterization made on an interim, quarterly, basis may not be representative of the actual full year characterization.
For the year ended March 31, 2017, distributions to common stockholders totaled $22.7 million and were less than our taxable income for the same year, when also considering prior spillover amounts under Section 855(a) of the Code. At March 31, 2017, we elected to treat $8.2 million of the first distributions paid after fiscal year-end as having been paid in the prior fiscal year, in accordance with Section 855(a) of the Code. In addition, we recorded a $1.3 million adjustment for estimated book-tax differences, which decreased Capital in excess of par value and increased Accumulated net realized gain (loss) and Net investment income in excess of distributions. For the year ended March 31, 2016, distributions to common stockholders totaled $22.7 million and were less than our taxable income for the same year, when also considering prior year spillover amounts under Section 855(a) of the Code. In addition, we recorded a $1.7 million adjustment for estimated book-tax differences, which decreased Capital in excess of par value and Accumulated net realized loss and increased Net investment income in excess of distributions. At March 31, 2016, we elected to treat $6.9 million of the first distributions paid after fiscal year-end as having been paid in the prior fiscal year, in accordance with Section 855(a) of the Code.
Preferred Stock Dividends
Our Board of Directors declared and we paid monthly cash dividends of (i) $0.1484375 per share to holders of our Series A Term Preferred Stock for each of the six months from April 2016 through September 2016 (after which we voluntarily redeemed in full our Series A Term Preferred Stock); (ii) $0.140625 per share to holders of our Series B Term Preferred Stock; and (iii) $0.135417 per share to holders of our Series C Term Preferred Stock for each month during the year ended March 31, 2017. Our Board of Directors also declared and we paid a combined dividend for the pro-rated period from and including the issuance date, September 26, 2016, to and including September 30, 2016 and the full month of October 2016, which totaled $0.15190972 per share, to the holders of our Series D Term Preferred Stock and monthly cash dividends of $0.13020833 per share to holders of our Series D Term Preferred Stock for each of the five months from November 2016 through March 2017.
55
In accordance with GAAP, we treat these monthly dividends as an operating expense. For federal income tax purposes, the dividends paid by us to preferred stockholders generally constitute ordinary income to the extent of our current and accumulated earnings and profits.
Dividend Reinvestment Plan
Our common stockholders who hold their shares through our transfer agent, Computershare, Inc. (“Computershare”), have the option to participate in a dividend reinvestment plan offered by Computershare. This is an “opt in” dividend reinvestment plan, meaning that common stockholders may elect to have their cash distributions automatically reinvested in additional shares of our common stock. Common stockholders who do not so elect will receive their distributions in cash. Common stockholders who receive distributions in the form of stock will be subject to the same federal, state and local tax consequences as stockholders who elect to receive their distributions in cash. The common stockholder will have an adjusted basis in the additional common shares purchased through the plan equal to the amount of the reinvested distribution. The additional shares will have a new holding period commencing on the day following the date on which the shares are credited to the common stockholder’s account. Our plan agent purchases shares in the open market in connection with the obligations under the plan. The Computershare dividend reinvestment plan is not open to holders of our preferred stock.
Equity
Registration Statement
On June 16, 2015, we filed a registration statement on Form N-2 (File No. 333-204996) with the SEC and subsequently filed a Pre-Effective Amendment No. 1 thereto on July 28, 2015, which the SEC declared effective on July 29, 2015. On June 8, 2016, we filed Post-Effective Amendment No. 1 to the registration statement, which the SEC declared effective on July 28, 2016. The registration statement permits us to issue, through one or more transactions, up to an aggregate of $300.0 million in securities, consisting of common stock, preferred stock, subscription rights, debt securities and warrants to purchase common or preferred stock, including through concurrent, separate offerings of such securities. After the Series D Term Preferred Stock offering in September 2016 and the common stock offering in May 2017, we currently have the ability to issue up to $222.2 million in securities under the registration statement.
Common Stock
Pursuant to our current registration statement on Form N-2 (File No. 333-204996), in May 2017, we completed a public offering of 2.1 million shares of our common stock at a public offering price of $9.38 per share, which was below our then current estimated NAV of $9.95 per share. Gross proceeds totaled $19.7 million and net proceeds, after deducting underwriting discounts and commissions and estimated offering costs borne by us, were $18.6 million, which was used to repay borrowings under the Credit Facility and other general corporate purposes. The underwriters also have a 30-day option expiring on June 8, 2017 to purchase up to 315,000 additional shares of common stock on the same terms and conditions solely to cover over-allotments, if any.
Pursuant to our prior registration statement on Form N-2 (Registration No. 333-181879), on March 13, 2015, we completed a public offering of 3.3 million shares of our common stock at a public offering price of $7.40 per share, which was below then current NAV of $8.55 per share. Gross proceeds totaled $24.4 million and net proceeds, after deducting underwriting discounts and offering costs borne by us, were $23.0 million, which were primarily used to repay borrowings under the Credit Facility. In connection with the offering, on April 2, 2015, the underwriters exercised their option to purchase an additional 495,000 shares at the public offering price to cover over-allotments, which resulted in gross proceeds of $3.7 million and net proceeds, after deducting underwriting discounts and offering costs borne by us, of $3.4 million.
We anticipate issuing equity securities to obtain additional capital in the future. However, we cannot determine the terms of any future equity issuances or whether we will be able to issue equity on terms favorable to us, or at all. When our common stock is trading at a price below NAV per share, as it has predominantly since September 30, 2008, the 1940 Act places regulatory constraints on our ability to obtain additional capital by issuing common stock. Generally, the 1940 Act provides that we may not issue and sell our common stock at a price below our NAV per common share, other than to our then existing common stockholders pursuant to a rights offering, without first obtaining approval from our stockholders and our independent directors and meeting other stated requirements. On May 12, 2017, the closing market price of our common stock was $9.20 per share, representing a 7.5% discount to our NAV of $9.95 as of March 31, 2017. To the extent that our common stock continues to trade at a market price below our NAV per common share, we will generally be precluded from raising equity capital through public offerings of our common stock, other than pursuant to stockholder approval or through a rights offering to existing common stockholders. At our 2016 Annual Meeting of Stockholders held on August 4, 2016, our stockholders approved a proposal authorizing us to issue and sell shares of our common stock at a price below our then current NAV per common share for a period of one year from the date of such approval, provided that our Board of Directors makes certain determinations prior to any such sale. At our 2017 Annual Meeting of Stockholders, scheduled to take place in August 2017, we will again ask our stockholders to vote in favor of a similar proposal so that it may be in effect for another year.
56
Term Preferred Stock
Pursuant to an earlier registration statement on Form N-2 (File No. 333-160720), in March 2012, we completed an offering of 1,600,000 shares of our Series A Term Preferred Stock at a public offering price of $25.00 per share. Gross proceeds totaled $40.0 million, and net proceeds, after deducting underwriting discounts and offering costs borne by us, were $38.0 million, a portion of which was used to repay borrowings under the Credit Facility, with the remaining proceeds being held to make additional investments and for general corporate purposes. Total underwriting discounts and offering costs related to this offering were $2.0 million, which have been recorded as discounts to the liquidation value on our accompanying Consolidated Statements of Assets and Liabilities and which, prior to the redemption in September 2016, were amortized over the period ending February 28, 2017, the mandatory redemption date.
In September 2016, we used a portion of the proceeds from the issuance of our Series D Term Preferred Stock, discussed below, to voluntarily redeem all 1.6 million outstanding shares of our Series A Term Preferred Stock, which had a liquidation preference of $25.00 per share. In connection with this voluntary redemption, we incurred a loss on extinguishment of debt of $0.2 million, which has been recorded in Realized loss on other in our accompanying Consolidated Statements of Operations and which was primarily comprised of unamortized deferred issuance costs at the time of redemption.
Prior to its redemption in September 2016, our Series A Term Preferred Stock provided for a fixed dividend equal to 7.125% per year, payable monthly (which equated to $2.9 million per year). We were required to redeem all of the outstanding Series A Term Preferred Stock on February 28, 2017, for cash at a redemption price equal to $25.00 per share plus an amount equal to accumulated but unpaid dividends, if any, to the date of redemption. Our Series A Term Preferred Stock was not convertible into our common stock or any other security.
Pursuant to our prior registration statement on Form N-2 (Registration No. 333-181879), in November 2014, we completed a public offering of 1,656,000 shares of our Series B Term Preferred Stock at a public offering price of $25.00 per share. Gross proceeds totaled $41.4 million and net proceeds, after deducting underwriting discounts and offering costs borne by us, were $39.7 million. Total underwriting discounts and offering costs related to this offering were $1.7 million, which have been recorded as discounts to the liquidation value on our accompanying Consolidated Statements of Assets and Liabilities and are being amortized over the period ending December 31, 2021, the mandatory redemption date.
Our Series B Term Preferred Stock is not convertible into our common stock or any other security. Our Series B Term Preferred Stock provides for a fixed dividend equal to 6.75% per year, payable monthly (which equates to $2.8 million per year). We are required to redeem all shares of our outstanding Series B Term Preferred Stock on December 31, 2021, for cash at a redemption price equal to $25.00 per share, plus an amount equal to accumulated but unpaid dividends, if any, to, but excluding, the date of redemption. In addition, two other potential mandatory redemption triggers are as follows: (1) upon the occurrence of certain events that would constitute a change in control of us, we would be required to redeem all of our outstanding Series B Term Preferred Stock, (2) if we fail to maintain an asset coverage ratio of at least 200%, we are required to redeem a portion of our outstanding Series B Term Preferred Stock or otherwise cure the ratio redemption trigger (and we may also redeem additional securities to cause the asset coverage ratio to be 215%). We may also voluntarily redeem all or a portion of our Series B Term Preferred Stock at our sole option at the redemption price at any time on or after December 31, 2017.
Also, pursuant to our prior registration statement on Form N-2 (Registration No. 333-181879), in May 2015, we completed a public offering of 1,610,000 shares of our Series C Term Preferred Stock at a public offering price of $25.00 per share. Gross proceeds totaled $40.3 million and net proceeds, after deducting underwriting discounts and offering costs borne by us, were $38.6 million. Total underwriting discounts and offering costs related to this offering were $1.6 million, which have been recorded as discounts to the liquidation value on our accompanying Consolidated Statements of Assets and Liabilities and are being amortized over the period ending May 31, 2022, the mandatory redemption date.
Our Series C Term Preferred Stock is not convertible into our common stock or any other security. Our Series C Term Preferred Stock provides for a fixed dividend equal to 6.50% per year, payable monthly (which equates to $2.6 million per year). We are required to redeem all shares of our outstanding Series C Term Preferred Stock on May 31, 2022, for cash at a redemption price equal to $25.00 per share, plus an amount equal to accumulated but unpaid dividends, if any, to, but excluding, the date of redemption. In addition, two other potential mandatory redemption triggers are as follows: (1) upon the occurrence of certain events that would constitute a change in control of us, we would be required to redeem all of our outstanding Series C Term Preferred Stock, (2) if we fail to maintain an asset coverage ratio of at least 200%, we are required to redeem a portion of our outstanding Series C Term Preferred Stock or otherwise cure the ratio redemption trigger (and we may also redeem additional securities to cause the asset coverage ratio to be 215%). We may also voluntarily redeem all or a portion of our Series C Term Preferred Stock at our sole option at the redemption price at any time on or after May 31, 2018.
57
Pursuant to our current registration statement on Form N-2 (Registration No. 333-204996), in September 2016, we completed a public offering of 2,300,000 shares of our Series D Term Preferred Stock at a public offering price of $25.00 per share. Gross proceeds totaled $57.5 million and net proceeds, after deducting underwriting discounts and offering costs borne by us, were $55.4 million. Total underwriting discounts and offering costs related to this offering were $2.1 million, which have been recorded as discounts to the liquidation value on our accompanying Consolidated Statements of Assets and Liabilities and are being amortized over the period ending September 30, 2023, the mandatory redemption date.
Our Series D Term Preferred Stock is not convertible into our common stock or any other security. Our Series D Term Preferred Stock provides for a fixed dividend equal to 6.25% per year, payable monthly (which equates to $3.6 million per year). We are required to redeem all shares of our outstanding Series D Term Preferred Stock on September 30, 2023, for cash at a redemption price equal to $25.00 per share, plus an amount equal to accumulated but unpaid dividends, if any, to, but excluding, the date of redemption. In addition, two other potential mandatory redemption triggers are as follows: (1) upon the occurrence of certain events that would constitute a change in control of us, we would be required to redeem all of our outstanding Series D Term Preferred Stock, and (2) if we fail to maintain an asset coverage ratio of at least 200% and are unable to correct such failure within a specific amount of time, we are required to redeem a portion of our outstanding Series D Term Preferred Stock or otherwise cure the ratio redemption trigger (and we may also redeem additional securities to cause the asset coverage ratio to be 240%). We may also voluntarily redeem all or a portion of our Series D Term Preferred Stock at our sole option at the redemption price at any time on or after September 30, 2018.
Each series of our mandatorily redeemable preferred stock has a preference over our common stock with respect to dividends, whereby no distributions are payable on our common stock unless the stated dividends, including any accrued and unpaid dividends, on the mandatorily redeemable preferred stock have been paid in full. The Series B Term Preferred Stock, Series C Term Preferred Stock, and Series D Term Preferred Stock are considered liabilities in accordance with GAAP and, as such, affect our asset coverage, exposing us to additional leverage risks. The asset coverage on our senior securities that are stock (our Series B Term Preferred Stock, Series C Term Preferred Stock, and Series D Term Preferred Stock) as of March 31, 2017 was 235.6%, calculated pursuant to Sections 18 and 61 of the 1940 Act.
Revolving Line of Credit
On November 16, 2016, we, through our wholly-owned subsidiary, Business Investment, entered into Amendment No. 2 to the Fifth Amended and Restated Credit Agreement, originally entered into on April 30, 2013 and as previously amended on June 26, 2014, with KeyBank National Association (“KeyBank”), as administrative agent, lead arranger, managing agent and lender, the Adviser, as servicer, and certain other lenders party thereto. The revolving period was extended to November 15, 2019, and if not renewed or extended by such date, all principal and interest will be due and payable on or before November 15, 2021 (two years after the revolving period end date). The amended Credit Facility provides two one-year extension options that may be exercised on or before the first and second anniversary of the November 16, 2016 amendment date, subject to approval by all lenders. Additionally, the Credit Facility commitment amount was changed from $185.0 million to $165.0 million and, subject to certain terms and conditions, can be expanded to a total facility amount of $250.0 million through additional commitments of existing or new lenders. Advances under the Credit Facility generally bear interest at 30-day LIBOR plus 3.15% per annum until November 15, 2019, with the margin then increasing to 3.40% for the period from November 15, 2019 to November 15, 2020, and increasing further to 3.65% thereafter. The Credit Facility has an unused commitment fee of 0.50% per annum on the portion of the total unused commitment amount that is less than or equal to 45.0% of the total commitment amount and 0.80% per annum on the total unused commitment amount that is greater than 45.0%. We incurred fees of approximately $1.4 million in connection with this amendment.
On January 20, 2017, we entered into Amendment No. 3 to the Credit Facility, which clarified a definition in the Company’s performance guaranty under the Credit Facility.
Interest is payable monthly during the term of the Credit Facility. Available borrowings are subject to various constraints and applicable advance rates, which are generally based on the size, characteristics, and quality of the collateral pledged by Business Investment. The Credit Facility also requires that any interest and principal payments on pledged loans be remitted directly by the borrower into a lockbox account with KeyBank. KeyBank is also the trustee of the account and generally remits the collected funds to us once a month.
Among other things, the Credit Facility contains covenants that require Business Investment to maintain its status as a separate legal entity, prohibit certain significant corporate transactions (such as mergers, consolidations, liquidations or dissolutions) and restrict certain material changes to our credit and collection policies without the lenders’ consent. The Credit Facility also generally seeks to restrict distributions to shareholders to the sum of (i) our net investment income, (ii) net capital gains, and (iii) amounts deemed by the
58
Company to be considered as having been paid during the prior fiscal year in accordance with Section 855(a) of the Code. Loans eligible to be pledged as collateral are subject to certain limitations, including, among other things, restrictions on geographic concentrations, industry concentrations, loan size, payment frequency and status, average life, portfolio company leverage, and lien property. The Credit Facility also requires Business Investment to comply with other financial and operational covenants, which obligate Business Investment to, among other things, maintain certain financial ratios, including asset and interest coverage and a minimum number of obligors required in the borrowing base. Additionally, the Credit Facility contains a performance guaranty that requires the Company to maintain (i) a minimum net worth (defined in the Credit Facility to include our mandatory redeemable term preferred stock) of the greater of $210.0 million or $210.0 million plus 50% of all equity and subordinated debt raised minus 50% of any equity or subordinated debt redeemed or retired after November 16, 2016, which equates to $210.0 million as of March 31, 2017, (ii) asset coverage with respect to senior securities representing indebtedness of at least 200%, in accordance with Sections 18 and 61 of the 1940 Act and (iii) our status as a BDC under the 1940 Act and as a RIC under the Code. As of March 31, 2017, and as defined in the performance guaranty of the Credit Facility, we had a net worth of $434.3 million, an asset coverage ratio on our senior securities representing indebtedness of 661.3%, calculated in compliance with the requirements of Sections 18 and 61 of the 1940 Act, and an active status as a BDC and RIC. As of March 31, 2017, we had availability, after adjustments for various constraints based on collateral quality, of $93.4 million under the Credit Facility and were in compliance with all covenants under the Credit Facility. As of May 12, 2017, we had availability, before adjustments for various constraints based on collateral quality, of $134.9 million under the Credit Facility.
In July 2013, pursuant to the terms of the then effective revolving line of credit, we entered into an interest rate cap agreement with KeyBank effective October 2013 for a notional amount of $45.0 million. The interest rate cap agreement expired in April 2016. Prior to its expiration in April 2016, the agreement effectively limited the interest rate on a portion of our borrowings under the then effective revolving line of credit. We incurred a premium fee of $75 in conjunction with this agreement, which was recorded in Net realized loss on other on our accompanying Consolidated Statements of Operations during the year ended March 31, 2017.
OFF-BALANCE SHEET ARRANGEMENTS
Unlike PIK income, we generally recognize success fees as income when the payment has been received. As a result, as of March 31, 2017 and 2016, we had unrecognized, contractual off-balance sheet success fee receivables of $24.2 million and $27.8 million (or approximately $0.80 and $0.92 per common share), respectively, on our debt investments. Consistent with GAAP, we generally have not recognized success fee receivables and related income in our Consolidated Financial Statements until earned. Due to the contingent nature of our success fees, there are no guarantees that we will be able to collect any or all of these success fees or know the timing of such collections.
CONTRACTUAL OBLIGATIONS
We have lines of credit and other uncalled capital commitments to certain of our portfolio companies that have not been fully drawn. Since these lines of credit and uncalled capital commitments have expiration dates and we expect many will never be fully drawn, the total line of credit and other uncalled capital commitment amounts do not necessarily represent future cash requirements. We estimate the fair value of the combined unused line of credit and other uncalled capital commitments as of March 31, 2017 to be immaterial.
In addition to the lines of credit and other uncalled capital commitments to our portfolio companies, we have also extended a guaranty on behalf of one of our portfolio companies, whereby we have guaranteed $2.0 million of obligations of Country Club Enterprises, LLC (“CCE”). The guaranty expires in February 2018, unless renewed. As of March 31, 2017, we have not been required to make payments on this or any previous guaranties, and we consider the credit risks to be remote and the fair value of this guaranty to be immaterial.
59
The following table shows our contractual obligations as of March 31, 2017, at cost:
| Payments Due by Period | ||||||||||||||||||||
| Contractual Obligations(A) |
Total | Less than 1 Year |
1-3 Years | 3-5 Years | More than 5 Years |
|||||||||||||||
| Credit Facility(B) |
$ | 69,700 | $ | — | $ | — | $ | 69,700 | $ | — | ||||||||||
| Mandatorily redeemable preferred stock |
139,150 | — | — | 41,400 | 97,750 | |||||||||||||||
| Secured borrowing |
5,096 | — | — | 5,096 | — | |||||||||||||||
| Interest payments on obligations(C) |
67,268 | 12,834 | 25,678 | 23,229 | 5,527 | |||||||||||||||
|
|
|
|
|
|
|
|
|
|
|
|||||||||||
| Total |
$ | 281,214 | $ | 12,834 | $ | 25,678 | $ | 139,425 | $ | 103,277 | ||||||||||
|
|
|
|
|
|
|
|
|
|
|
|||||||||||
| (A) | Excludes unused line of credit commitments, uncalled capital commitments and guaranties to our portfolio companies in the aggregate principal amount of $4.9 million. |
| (B) | Principal balance of borrowings outstanding under the Credit Facility, based on the maturity date following the current contractual revolving period end date. |
| (C) | Includes interest payments due on the Credit Facility and secured borrowing, and dividend obligations on each series of our mandatorily redeemable preferred stock. The amount of interest expense calculated for purposes of this table was based upon rates and outstanding balances as of March 31, 2017. Dividend obligations on our mandatorily redeemable preferred stock assume quarterly declarations and monthly dividend payments through the date of mandatory redemption of each series. |
Litigation
From time to time, we may become involved in various investigations, claims and legal proceedings that arise in the ordinary course of our business. Furthermore, third parties may try to seek to impose liability on us in connection with the activities of our portfolio companies. While we do not expect that the resolution of these matters if they arise would materially affect our business, financial condition, results of operations or cash flows, resolution will be subject to various uncertainties and could result in the expenditure of significant financial and managerial resources.
Critical Accounting Policies
The preparation of financial statements and related disclosures in conformity with GAAP requires management to make estimates and assumptions that affect the reported consolidated amounts of assets and liabilities, including disclosure of contingent assets and liabilities at the date of the financial statements, and revenues and expenses during the period reported. Actual results could differ materially from those estimates under different assumptions or conditions. We have identified our investment valuation policy (which has been approved by our Board of Directors) as our most critical accounting policy, which is described in Note 2 — Summary of Significant Accounting Policies in the accompanying notes to our Consolidated Financial Statements included elsewhere in this Annual Report on Form 10-K. Additionally, refer to Note 3 — Investments in the accompanying notes to our Consolidated Financial Statements included elsewhere in this Annual Report on Form 10-K for additional information regarding fair value measurements and our application of Financial Accounting Standards Board Accounting Standards Codification Topic 820, “Fair Value Measurements and Disclosures.” We have also identified our revenue recognition policy as a critical accounting policy, which is described in Note 2 — Summary of Significant Accounting Policies in the accompanying notes to our Consolidated Financial Statements included elsewhere in this Annual Report on Form 10-K.
Investment Valuation
Credit Monitoring and Risk Rating
The Adviser monitors a wide variety of key credit statistics that provide information regarding our portfolio companies to help us assess credit quality and portfolio performance and, in some instances, are used as inputs in our valuation techniques. Generally, we, through the Adviser, participate in periodic board meetings of our portfolio companies in which we hold board seats and also require them to provide annual audited and monthly unaudited financial statements. Using these statements or comparable information and board discussions, the Adviser calculates and evaluates certain credit statistics.
The Adviser risk rates all of our investments in debt securities. The Adviser does not risk rate our equity securities. For loans that have been rated by a Nationally Recognized Statistical Rating Organization (“NRSRO”) (as defined in Rule 2a-7 under the 1940 Act), the Adviser generally uses the average of two corporate level NRSRO’s risk ratings for such security. For all other debt securities, the Adviser uses a proprietary risk rating system. While the Adviser seeks to mirror the NRSRO systems, we cannot provide any assurance that the Adviser’s risk rating system will provide the same risk rating as an NRSRO for these securities. The Adviser’s risk rating system is used to estimate the probability of default on debt securities and the expected loss if there is a default. The Adviser’s
60
risk rating system uses a scale of 0 to >10, with >10 being the lowest probability of default. It is the Adviser’s understanding that most debt securities of Lower Middle Market do not exceed the grade of BBB on an NRSRO scale, so there would be no debt securities in the Lower Middle Market that would meet the definition of AAA, AA or A. Therefore, the Adviser’s scale begins with the designation >10 as the best risk rating which may be equivalent to a BBB from an NRSRO; however, no assurance can be given that a >10 on the Adviser’s scale is equal to a BBB or Baa2 on an NRSRO scale. The Adviser’s risk rating system covers both qualitative and quantitative aspects of the business and the securities we hold.
The following table reflects risk ratings for all loans in our portfolio as of March 31, 2017 and 2016:
| As of March 31, |
||||||||
| Rating |
2017 | 2016 | ||||||
| Highest |
10.0 | 10.0 | ||||||
| Average |
6.1 | 6.0 | ||||||
| Weighted Average |
6.5 | 6.2 | ||||||
| Lowest |
3.0 | 3.0 | ||||||
Tax Status
We intend to continue to maintain our qualification as a RIC under Subchapter M of the Code for federal income tax purposes. As a RIC, we generally are not subject to federal income tax on the portion of our taxable income and gains distributed to our stockholders. To maintain our qualification as a RIC, we must maintain our status as a BDC and meet certain source-of-income and asset diversification requirements. In addition, in order to qualify to be taxed as a RIC, we must distribute to stockholders at least 90% of our Investment Company Taxable Income. Our policy generally is to make distributions to our stockholders in an amount up to 100% of our Investment Company Taxable Income.
In an effort to limit certain federal excise taxes imposed on RICs, we generally intend to distribute to our stockholders, during each calendar year, an amount close to the sum of: (1) 98% of our ordinary income for the calendar year, (2) 98.2% of our capital gains in excess of capital losses for the one-year period ending on October 31 of the calendar year, and (3) any ordinary income and capital gains in excess of capital losses from preceding years that were not distributed during such years. Under the RIC Modernization Act, we are permitted to carryforward capital losses incurred in taxable years beginning after March 31, 2011, for an unlimited period. Additionally, post-enactment capital loss carryforwards will retain their character as either short-term or long-term capital losses rather than being considered all short-term as permitted under the Treasury regulations applicable to pre-enactment capital loss carryforwards. Our capital loss carryforward balance was $0 and $13.6 million as of March 31, 2017 and 2016, respectively.
Recent Accounting Pronouncements
See Note 2 — Summary of Significant Accounting Policies in the accompanying notes to our Consolidated Financial Statements included elsewhere in this Annual Report on Form 10-K for a description of recent accounting pronouncements.
61
ITEM 7A. QUANTITATIVE AND QUALITATIVE DISCLOSURES ABOUT MARKET RISK
Market risk includes risks that arise from changes in interest rates, foreign currency exchange rates, commodity prices, equity prices and other market changes that affect market sensitive instruments. The prices of securities held by us may decline in response to certain events, including those directly involving the companies whose securities are owned by us; conditions affecting the general economy; overall market changes; local, regional or global political, social or economic instability; and interest rate fluctuations.
The primary risk we believe we are exposed to is interest rate risk. Because we borrow money to make investments, our net investment income is dependent upon the difference between the rates at which we borrow funds, such as under the Credit Facility (which is variable) and our mandatorily redeemable preferred stock (which are fixed), and the rates at which we invest those funds. As a result, there can be no assurance that a significant change in market interest rates will not have a material adverse effect on our net investment income. We use a combination of debt and equity capital to finance our investing activities. We may use interest rate risk management techniques to limit our exposure to interest rate fluctuations. Such techniques may include various interest rate hedging activities to the extent permitted by the 1940 Act.
We target to have approximately 10% of the loans in our portfolio at fixed rates, with approximately 90% at variable rates or variables rates with a floor mechanism. Currently, all of our variable-rate loans have rates associated with the current 30-day LIBOR rate. As of March 31, 2017, our portfolio consisted of the following breakdown based on the total principal balance of all outstanding debt investments:
| 92.9% | Variable rates with a floor | |||
| 7.1 | Fixed rates | |||
|
|
|
|||
| 100.0% | Total | |||
|
|
|
Advances under the Credit Facility generally bear interest at 30-day LIBOR, plus 3.15% per annum, and the Credit Facility includes an unused fee of 0.50% per annum on the portion of the total unused commitment amount that is less than or equal to 45.0% of the total commitment amount and 0.80% per annum on the total unused commitment amount that is greater than 45.0%. Once the revolving period ends, the interest rate margin increases to 3.40% for the period from November 15, 2019 to November 15, 2020, and further increases to 3.65% through maturity.
To illustrate the potential impact of changes in interest rates, we have performed the following hypothetical analysis, which assumes that our balance sheet and interest rates remain constant as of March 31, 2017 and no further actions are taken to alter our existing interest rate sensitivity.
| Basis Point Change (A) |
Increase in Interest Income |
Increase (Decrease) in Interest Expense |
Net (Decrease) Increase in Net Assets Resulting from Operations |
|||||||||
| Up 300 basis points |
$ | 6,645 | $ | 2,091 | $ | 4,554 | ||||||
| Up 200 basis points |
3,572 | 1,394 | 2,178 | |||||||||
| Up 100 basis points |
766 | 697 | 69 | |||||||||
| Down 98 basis points |
(31 | ) | (685 | ) | 654 | |||||||
| (A) | As of March 31, 2017, our effective average LIBOR was 0.98%, therefore the largest decrease in basis points that could occur was 98 basis points. |
Although management believes that this analysis is indicative of our existing interest rate sensitivity, it does not adjust for potential changes in credit quality, size and composition of our loan portfolio on the balance sheet and other business developments that could affect net increase (decrease) in net assets resulting from operations. Accordingly, actual results could differ significantly from those in the hypothetical analysis in the table above.
We may also experience risk associated with investing in securities of companies with foreign operations. Some of our portfolio companies have operations located outside the U.S. These risks include, but are not limited to, fluctuations in foreign currency exchange rates, imposition of foreign taxes, changes in exportation regulations and political and social instability.
62
ITEM 8. FINANCIAL STATEMENTS AND SUPPLEMENTARY DATA
Index to Consolidated Financial Statements
63
Management’s Annual Report on Internal Control over Financial Reporting
To the Stockholders and Board of Directors of Gladstone Investment Corporation:
Our management is responsible for establishing and maintaining adequate internal control over financial reporting as defined in Rule 13a-15(f) under the Securities Exchange Act of 1934. Our internal control over financial reporting is designed to provide reasonable assurance regarding the reliability of financial reporting and the preparation of financial statements for external purposes in accordance with generally accepted accounting principles and include those policies and procedures that: (1) pertain to the maintenance of records that in reasonable detail accurately and fairly reflect our transactions and the dispositions of our assets; (2) provide reasonable assurance that our transactions are recorded as necessary to permit preparation of financial statements in accordance with generally accepted accounting principles, and that our receipts and expenditures are being made only in accordance with appropriate authorizations; and (3) provide reasonable assurance regarding prevention or timely detection of unauthorized acquisition, use or disposition of our assets that could have a material effect on our financial statements.
Because of its inherent limitations, internal control over financial reporting may not prevent or detect misstatements. Therefore, even those systems determined to be effective can provide only reasonable assurance with respect to financial statement preparation and presentation.
Under the supervision and with the participation of our management, including our chief executive officer and our chief financial officer, we assessed the effectiveness of our internal control over financial reporting as of March 31, 2017, using the criteria set forth by the Committee of Sponsoring Organizations of the Treadway Commission (COSO) in Internal Control — Integrated Framework (2013). Based on its assessment, management has concluded that our internal control over financial reporting was effective as of March 31, 2017.
The effectiveness of our internal control over financial reporting as of March 31, 2017 has been audited by PricewaterhouseCoopers LLP, an independent registered public accounting firm, as stated in their report which is included herein.
May 15, 2017
64
Report of Independent Registered Public Accounting Firm
To the Board of Directors and Stockholders of Gladstone Investment Corporation:
In our opinion, the accompanying consolidated statements of assets and liabilities, including the consolidated schedules of investments, and the related consolidated statements of operations, of changes in net assets and of cash flows present fairly, in all material respects, the financial position of Gladstone Investment Corporation and its subsidiaries (the “Company”) as of March 31, 2017 and March 31, 2016, and the results of their operations, their changes in net assets and their cash flows for each of the three years in the period ended March 31, 2017, in conformity with accounting principles generally accepted in the United States of America. In addition, in our opinion, the financial statement schedule listed in the index appearing under Item 15(a)(2) presents fairly, in all material respects, the information set forth therein when read in conjunction with the related consolidated financial statements. Also, in our opinion, the Company maintained, in all material respects, effective internal control over financial reporting as of March 31, 2017, based on criteria established in Internal Control — Integrated Framework (2013) issued by the Committee of Sponsoring Organizations of the Treadway Commission (COSO). The Company’s management is responsible for these financial statements and financial statement schedule, for maintaining effective internal control over financial reporting and for its assessment of the effectiveness of internal control over financial reporting, included in the accompanying Management’s Annual Report on Internal Control over Financial Reporting. Our responsibility is to express opinions on these financial statements, on the financial statement schedule, and on the Company’s internal control over financial reporting based on our integrated audits. We conducted our audits in accordance with the standards of the Public Company Accounting Oversight Board (United States). Those standards require that we plan and perform the audits to obtain reasonable assurance about whether the financial statements are free of material misstatement and whether effective internal control over financial reporting was maintained in all material respects. Our audits of the financial statements included examining, on a test basis, evidence supporting the amounts and disclosures in the financial statements, assessing the accounting principles used and significant estimates made by management, and evaluating the overall financial statement presentation. Our audit of internal control over financial reporting included obtaining an understanding of internal control over financial reporting, assessing the risk that a material weakness exists, and testing and evaluating the design and operating effectiveness of internal control based on the assessed risk. Our audits also included performing such other procedures as we considered necessary in the circumstances. We believe that our audits, which included confirmation of securities as of March 31, 2017 and March 31, 2016, by correspondence with the custodian and portfolio company investees, and the application of alternative auditing procedures where replies have not been received, provide a reasonable basis for our opinions.
A company’s internal control over financial reporting is a process designed to provide reasonable assurance regarding the reliability of financial reporting and the preparation of financial statements for external purposes in accordance with generally accepted accounting principles. A company’s internal control over financial reporting includes those policies and procedures that (i) pertain to the maintenance of records that, in reasonable detail, accurately and fairly reflect the transactions and dispositions of the assets of the company; (ii) provide reasonable assurance that transactions are recorded as necessary to permit preparation of financial statements in accordance with generally accepted accounting principles, and that receipts and expenditures of the company are being made only in accordance with authorizations of management and directors of the company; and (iii) provide reasonable assurance regarding prevention or timely detection of unauthorized acquisition, use, or disposition of the company’s assets that could have a material effect on the financial statements.
Because of its inherent limitations, internal control over financial reporting may not prevent or detect misstatements. Also, projections of any evaluation of effectiveness to future periods are subject to the risk that controls may become inadequate because of changes in conditions, or that the degree of compliance with the policies or procedures may deteriorate.
/s/ PricewaterhouseCoopers LLP
McLean, VA
May 15, 2017
65
GLADSTONE INVESTMENT CORPORATION
CONSOLIDATED STATEMENTS OF ASSETS AND LIABILITIES
(DOLLAR AMOUNTS IN THOUSANDS EXCEPT PER SHARE AMOUNTS)
| March 31, | ||||||||
| 2017 | 2016 | |||||||
| ASSETS |
||||||||
| Investments at fair value |
||||||||
|
Non-Control/Non-Affiliate investments (Cost of $225,046 and $191,757, respectively) |
$ | 223,451 | $ | 180,933 | ||||
| Affiliate investments (Cost of $278,811 and $304,856, respectively) |
262,086 | 296,723 | ||||||
| Control investments (Cost of $21,312 and $21,512, respectively) |
16,042 | 10,000 | ||||||
|
|
|
|
|
|||||
| Total investments at fair value (Cost of $525,169 and $518,125, respectively) |
501,579 | 487,656 | ||||||
| Cash and cash equivalents |
2,868 | 4,481 | ||||||
| Restricted cash and cash equivalents |
1,231 | 1,107 | ||||||
| Interest receivable |
2,305 | 2,790 | ||||||
| Due from custodian |
2,238 | 1,638 | ||||||
| Deferred financing costs, net |
1,588 | 1,147 | ||||||
| Other assets, net |
3,386 | 4,256 | ||||||
|
|
|
|
|
|||||
| TOTAL ASSETS |
$ | 515,195 | $ | 503,075 | ||||
|
|
|
|
|
|||||
| LIABILITIES |
||||||||
| Borrowings: |
||||||||
| Line of credit at fair value (Cost of $69,700 and $95,000, respectively) |
$ | 69,700 | $ | 95,000 | ||||
| Secured borrowing |
5,096 | 5,096 | ||||||
|
|
|
|
|
|||||
| Total borrowings |
74,796 | 100,096 | ||||||
| Mandatorily redeemable preferred stock, $0.001 par value, $25 liquidation preference; 6,356,000 and 4,956,000 shares authorized, respectively; 5,566,000 and 4,866,000 shares issued and outstanding, respectively, net |
134,835 | 118,465 | ||||||
| Accounts payable and accrued expenses |
578 | 1,054 | ||||||
| Fees due to Adviser(A) |
1,671 | 1,912 | ||||||
| Fee due to Administrator(A) |
296 | 311 | ||||||
| Other liabilities |
1,937 | 2,215 | ||||||
|
|
|
|
|
|||||
| TOTAL LIABILITIES |
214,113 | 224,053 | ||||||
|
|
|
|
|
|||||
| Commitments and contingencies(B) |
||||||||
| NET ASSETS |
$ | 301,082 | $ | 279,022 | ||||
|
|
|
|
|
|||||
| ANALYSIS OF NET ASSETS |
||||||||
| Common stock, $0.001 par value per share, 100,000,000 shares authorized; 30,270,958 shares issued and outstanding |
$ | 30 | $ | 30 | ||||
| Capital in excess of par value |
310,332 | 311,608 | ||||||
| Cumulative net unrealized depreciation of investments |
(23,590 | ) | (30,469 | ) | ||||
| Cumulative net unrealized depreciation of other |
— | (75 | ) | |||||
| Net investment income in excess of distributions |
7,283 | 6,426 | ||||||
| Accumulated net realized gain (loss) |
7,027 | (8,498 | ) | |||||
|
|
|
|
|
|||||
| TOTAL NET ASSETS |
$ | 301,082 | $ | 279,022 | ||||
|
|
|
|
|
|||||
| NET ASSET VALUE PER SHARE AT END OF YEAR |
$ | 9.95 | $ | 9.22 | ||||
|
|
|
|
|
|||||
| (A) | Refer to Note 4 — Related Party Transactions for additional information. |
| (B) | Refer to Note 11 — Commitments and Contingencies for additional information. |
THE ACCOMPANYING NOTES ARE AN INTEGRAL PART OF THESE CONSOLIDATED FINANCIAL STATEMENTS.
66
GLADSTONE INVESTMENT CORPORATION
CONSOLIDATED STATEMENTS OF OPERATIONS
(DOLLAR AMOUNTS IN THOUSANDS EXCEPT PER SHARE AMOUNTS)
| Year Ended March 31, | ||||||||||||
| 2017 | 2016 | 2015 | ||||||||||
| INVESTMENT INCOME |
||||||||||||
| Interest income: |
||||||||||||
|
Non-Control/Non-Affiliate investments |
$ | 17,385 | $ | 16,604 | $ | 17,541 | ||||||
| Affiliate investments |
27,941 | 28,071 | 16,844 | |||||||||
| Control investments |
818 | 1,720 | 2,296 | |||||||||
| Cash and cash equivalents |
3 | 2 | 4 | |||||||||
|
|
|
|
|
|
|
|||||||
| Total interest income |
46,147 | 46,397 | 36,685 | |||||||||
| Other income: |
||||||||||||
|
Non-Control/Non-Affiliate investments |
1,160 | 3,720 | 4,424 | |||||||||
| Affiliate investments |
4,568 | 838 | 534 | |||||||||
|
|
|
|
|
|
|
|||||||
| Total other income |
5,728 | 4,558 | 4,958 | |||||||||
|
|
|
|
|
|
|
|||||||
| Total investment income |
51,875 | 50,955 | 41,643 | |||||||||
|
|
|
|
|
|
|
|||||||
| EXPENSES |
||||||||||||
| Base management fee(A) |
9,925 | 9,925 | 7,569 | |||||||||
| Loan servicing fee(A) |
6,606 | 6,697 | 4,994 | |||||||||
| Incentive fee(A) |
4,750 | 5,179 | 4,975 | |||||||||
| Administration fee(A) |
1,120 | 1,190 | 932 | |||||||||
| Interest expense on borrowings |
3,540 | 4,154 | 3,539 | |||||||||
| Dividends on mandatorily redeemable preferred stock |
8,683 | 7,963 | 3,921 | |||||||||
| Amortization of deferred financing costs and discounts |
1,875 | 1,908 | 1,329 | |||||||||
| Professional fees |
698 | 1,192 | 908 | |||||||||
| Other general and administrative expenses |
2,368 | 1,854 | 1,421 | |||||||||
|
|
|
|
|
|
|
|||||||
| Expenses before credits from Adviser |
39,565 | 40,062 | 29,588 | |||||||||
|
|
|
|
|
|
|
|||||||
| Credits to base management fee — loan servicing fee(A) |
(6,606 | ) | (6,697 | ) | (4,994 | ) | ||||||
| Credits to fees from Adviser — other(A) |
(3,506 | ) | (3,126 | ) | (2,848 | ) | ||||||
|
|
|
|
|
|
|
|||||||
| Total expenses, net of credits to fees |
29,453 | 30,239 | 21,746 | |||||||||
|
|
|
|
|
|
|
|||||||
| NET INVESTMENT INCOME |
$ | 22,422 | $ | 20,716 | $ | 19,897 | ||||||
|
|
|
|
|
|
|
|||||||
| REALIZED AND UNREALIZED GAIN (LOSS) |
||||||||||||
| Net realized gain (loss): |
||||||||||||
|
Non-Control/Non-Affiliate investments |
$ | 1,086 | $ | 17,038 | $ | — | ||||||
| Affiliate investments |
14,558 | (11,424 | ) | — | ||||||||
| Control investments |
(3 | ) | (10,213 | ) | (73 | ) | ||||||
| Other |
(254 | ) | — | — | ||||||||
|
|
|
|
|
|
|
|||||||
| Total net realized gain (loss) |
15,387 | (4,599 | ) | (73 | ) | |||||||
| Net unrealized appreciation (depreciation): |
||||||||||||
|
Non-Control/Non-Affiliate investments |
9,230 | (22,599 | ) | 37,047 | ||||||||
| Affiliate investments |
(8,593 | ) | 31,446 | (4,233 | ) | |||||||
| Control investments |
6,242 | (110 | ) | (2,874 | ) | |||||||
| Other |
75 | — | 450 | |||||||||
|
|
|
|
|
|
|
|||||||
| Total net unrealized appreciation |
6,954 | 8,737 | 30,390 | |||||||||
|
|
|
|
|
|
|
|||||||
| Net realized and unrealized gain |
22,341 | 4,138 | 30,317 | |||||||||
|
|
|
|
|
|
|
|||||||
| NET INCREASE IN NET ASSETS RESULTING FROM OPERATIONS |
$ | 44,763 | $ | 24,854 | $ | 50,214 | ||||||
|
|
|
|
|
|
|
|||||||
| BASIC AND DILUTED PER COMMON SHARE: |
||||||||||||
| Net investment income |
$ | 0.74 | $ | 0.68 | $ | 0.75 | ||||||
|
|
|
|
|
|
|
|||||||
| Net increase in net assets resulting from operations |
$ | 1.48 | $ | 0.82 | $ | 1.88 | ||||||
|
|
|
|
|
|
|
|||||||
| Distributions |
$ | 0.75 | $ | 0.75 | $ | 0.77 | ||||||
|
|
|
|
|
|
|
|||||||
| WEIGHTED AVERAGE SHARES OF COMMON STOCK OUTSTANDING: |
|
|||||||||||
| Basic and diluted |
30,270,958 | 30,268,253 | 26,665,821 | |||||||||
| (A) | Refer to Note 4 — Related Party Transactions for additional information. |
THE ACCOMPANYING NOTES ARE AN INTEGRAL PART OF THESE CONSOLIDATED FINANCIAL STATEMENTS.
67
GLADSTONE INVESTMENT CORPORATION
CONSOLIDATED STATEMENTS OF CHANGES IN NET ASSETS
(IN THOUSANDS)
| Year Ended March 31, | ||||||||||||
| 2017 | 2016 | 2015 | ||||||||||
| OPERATIONS: |
||||||||||||
| Net investment income |
$ | 22,422 | $ | 20,716 | $ | 19,897 | ||||||
| Net realized gain (loss) on investments |
15,641 | (4,599 | ) | (73 | ) | |||||||
| Net realized loss on other |
(254 | ) | — | — | ||||||||
| Net unrealized appreciation of investments |
6,879 | 8,737 | 29,940 | |||||||||
| Net unrealized depreciation of other |
75 | — | 450 | |||||||||
|
|
|
|
|
|
|
|||||||
| Net increase in net assets from operations |
44,763 | 24,854 | 50,214 | |||||||||
|
|
|
|
|
|
|
|||||||
| DISTRIBUTIONS TO STOCKHOLDERS: |
||||||||||||
| Distributions to common stockholders from net investment income |
(22,703 | ) | (19,515 | ) | (20,584 | ) | ||||||
| Distributions to common stockholders from realized gains |
— | (3,188 | ) | — | ||||||||
|
|
|
|
|
|
|
|||||||
| Net decrease in net assets from distributions to stockholders |
(22,703 | ) | (22,703 | ) | (20,584 | ) | ||||||
|
|
|
|
|
|
|
|||||||
| CAPITAL STOCK TRANSACTIONS: |
||||||||||||
| Issuance of common stock |
— | 3,663 | 24,420 | |||||||||
| Offering costs for issuance of common stock |
— | (221 | ) | (1,458 | ) | |||||||
|
|
|
|
|
|
|
|||||||
| Net increase in net assets from capital stock transactions |
— | 3,442 | 22,962 | |||||||||
|
|
|
|
|
|
|
|||||||
| TOTAL INCREASE (DECREASE) IN NET ASSETS |
22,060 | 5,593 | 52,592 | |||||||||
| NET ASSETS, BEGINNING OF YEAR |
279,022 | 273,429 | 220,837 | |||||||||
|
|
|
|
|
|
|
|||||||
| NET ASSETS, END OF YEAR |
$ | 301,082 | $ | 279,022 | $ | 273,429 | ||||||
|
|
|
|
|
|
|
|||||||
THE ACCOMPANYING NOTES ARE AN INTEGRAL PART OF THESE CONSOLIDATED FINANCIAL STATEMENTS.
68
GLADSTONE INVESTMENT CORPORATION
CONSOLIDATED STATEMENTS OF CASH FLOWS
(IN THOUSANDS)
| Year Ended March 31, | ||||||||||||
| 2017 | 2016 | 2015 | ||||||||||
| CASH FLOWS FROM OPERATING ACTIVITIES |
||||||||||||
| Net increase in net assets resulting from operations |
$ | 44,763 | $ | 24,854 | $ | 50,214 | ||||||
| Adjustments to reconcile net increase (decrease) in net assets resulting from operations to net cash provided by (used in) operating activities: |
||||||||||||
| Purchase of investments |
(62,446 | ) | (61,896 | ) | (132,902 | ) | ||||||
| Principal repayments of investments |
31,886 | 24,205 | 11,260 | |||||||||
| Increase in investment balance due to paid in kind interest |
— | — | (78 | ) | ||||||||
| Net proceeds from the sale of investments |
36,939 | 20,377 | — | |||||||||
| Net realized (gain) loss on investments |
(15,196 | ) | 4,448 | 73 | ||||||||
| Net realized loss on other |
239 | — | — | |||||||||
| Net unrealized appreciation of investments |
(6,879 | ) | (8,737 | ) | (29,940 | ) | ||||||
| Net unrealized depreciation of other |
(75 | ) | — | (450 | ) | |||||||
| Amortization of deferred financing costs and discounts |
1,875 | 1,908 | 1,329 | |||||||||
| Bad debt expense, net of recoveries |
650 | 267 | 186 | |||||||||
| Changes in assets and liabilities: |
||||||||||||
| Decrease (increase) in restricted cash and cash equivalents |
171 | (847 | ) | 4,981 | ||||||||
| Increase in interest receivable |
(253 | ) | (1,133 | ) | (578 | ) | ||||||
| (Increase) decrease in due from custodian |
(600 | ) | 2,874 | (2,808 | ) | |||||||
| Decrease (increase) in other assets, net |
3,065 | (2,934 | ) | (479 | ) | |||||||
| (Decrease) increase in accounts payable and accrued expenses |
(476 | ) | (217 | ) | 606 | |||||||
| (Decrease) increase in fees due to Adviser(A) |
(241 | ) | 410 | 277 | ||||||||
| (Decrease) increase in fee due to Administrator(A) |
(15 | ) | 49 | 38 | ||||||||
| (Decrease) increase in other liabilities |
(928 | ) | 454 | 719 | ||||||||
|
|
|
|
|
|
|
|||||||
| Net cash provided by (used in) operating activities |
32,479 | 4,082 | (97,552 | ) | ||||||||
|
|
|
|
|
|
|
|||||||
| CASH FLOWS FROM FINANCING ACTIVITIES |
||||||||||||
| Proceeds from issuance of common stock |
— | 3,663 | 24,420 | |||||||||
| Offering costs for issuance of common stock |
— | (221 | ) | (1,458 | ) | |||||||
| Borrowings from line of credit |
83,400 | 105,000 | 144,549 | |||||||||
| Repayments on line of credit |
(108,700 | ) | (128,800 | ) | (87,000 | ) | ||||||
| Proceeds from secured borrowings |
— | — | 96 | |||||||||
| Proceeds from issuance of mandatorily redeemable preferred stock |
57,500 | 40,250 | 41,400 | |||||||||
| Redemption of mandatorily redeemable preferred stock |
(40,000 | ) | — | — | ||||||||
| Deferred financing and offering costs |
(3,589 | ) | (1,711 | ) | (3,503 | ) | ||||||
| Distributions paid to common stockholders |
(22,703 | ) | (22,703 | ) | (20,584 | ) | ||||||
|
|
|
|
|
|
|
|||||||
| Net cash (used in) provided by financing activities |
(34,092 | ) | (4,522 | ) | 97,920 | |||||||
|
|
|
|
|
|
|
|||||||
| NET (DECREASE) INCREASE IN CASH AND CASH EQUIVALENTS |
(1,613 | ) | (440 | ) | 368 | |||||||
| CASH AND CASH EQUIVALENTS, BEGINNING OF YEAR |
4,481 | 4,921 | 4,553 | |||||||||
|
|
|
|
|
|
|
|||||||
| CASH AND CASH EQUIVALENTS, END OF YEAR |
$ | 2,868 | $ | 4,481 | $ | 4,921 | ||||||
|
|
|
|
|
|
|
|||||||
| CASH PAID FOR INTEREST |
$ | 3,018 | $ | 3,679 | $ | 3,310 | ||||||
|
|
|
|
|
|
|
|||||||
| NON-CASH ACTIVITIES(B) |
$ | 8,796 | $ | 13,944 | $ | — | ||||||
|
|
|
|
|
|
|
|||||||
| (A) | Refer to Note 4 — Related Party Transactions for additional information. |
| (B) | 2017: Significant non-cash operating activities consisted principally of the following transaction: |
In October 2016, we restructured our investment in D.P.M.S., Inc. (“Danco”), which resulted in the exchange of our existing debt investments with a total cost basis and fair value of $16.5 million and $6.4 million, respectively, for a new $8.8 million secured first lien term loan. We also relinquished our preferred equity investment and a portion of our common equity investment, which had an aggregate cost basis and fair value of $2.5 million and $0 million, respectively. The transaction resulted in a net realized loss of $10.2 million, which was recorded in our Consolidated Statements of Operations during the year ended March 31, 2017.
2016: Significant non-cash operating activities consisted principally of the following transaction:
In August 2015, NDLI, Inc. (“NDLI”) was acquired by Diligent Delivery Systems (“Diligent”). As part of this acquisition, we restructured our investment in NDLI, which resulted in the termination of our debt investments in NDLI, which had a cost basis and fair value of $17.7 million and $14.2 million, respectively. We received cash proceeds of $1.9 million and a $13.0 million secured second lien debt investment in Diligent, which resulted in a net realized loss of $2.8 million. We recognized this net realized loss in our Consolidated Statements of Operations during the fiscal year ended March 31, 2016.
THE ACCOMPANYING NOTES ARE AN INTEGRAL PART OF THESE CONSOLIDATED FINANCIAL STATEMENTS.
69
GLADSTONE INVESTMENT CORPORATION
CONSOLIDATED SCHEDULE OF INVESTMENTS
MARCH 31, 2017
(DOLLAR AMOUNTS IN THOUSANDS)
| Company(A) |
Industry |
Investment(B)(F) |
Principal | Cost | Fair Value |
|||||||||||
|
NON-CONTROL/NON-AFFILIATE INVESTMENTS(N): |
||||||||||||||||
| AquaVenture Holdings Limited |
Utilities |
Common Stock (201,586 shares)(C)(S) |
$ | $ | 3,397 | $ | 3,433 | |||||||||
|
|
|
|
|
|||||||||||||
| 3,397 | 3,433 | |||||||||||||||
| B-Dry, LLC |
Personal, Food and Miscellaneous Services |
Secured First Lien Line of Credit, $500 available (7.3% (0.8% Unused Fee), Due 12/2018)(L) |
4,150 | 4,150 | 4,150 | |||||||||||
| Secured First Lien Term Debt (1.5%, Due 12/2019)(L) |
6,443 | 6,443 | 205 | |||||||||||||
| Secured First Lien Term Debt (1.5%, Due 12/2019)(L) |
840 | 840 | — | |||||||||||||
| Preferred Stock
(2,500 |
2,516 | — | ||||||||||||||
| Common Stock (2,500 |
300 | — | ||||||||||||||
|
|
|
|
|
|||||||||||||
| 14,249 | 4,355 | |||||||||||||||
| Counsel Press, Inc. |
Diversified/Conglomerate Services |
Secured First Lien Line of Credit, $500 available (12.8% (1.0% Unused Fee), Due 3/2018)(L) |
— | — | — | |||||||||||
| Secured First Lien Term Debt (12.8%, Due 3/2020)(L) |
18,000 | 18,000 | 18,000 | |||||||||||||
| Secured First Lien Term Debt (14.0%, Due 3/2020)(L) |
5,500 | 5,500 | 5,500 | |||||||||||||
| Preferred Stock
(6,995 |
6,995 | 6,117 | ||||||||||||||
|
|
|
|
|
|||||||||||||
| 30,495 | 29,617 | |||||||||||||||
| Country Club Enterprises, LLC |
Automobile |
Secured Second Lien Term Debt (18.7%, Due 5/2017)(L) |
4,000 | 4,000 | 4,000 | |||||||||||
| Preferred Stock (7,245,681 shares)(C)(L) |
7,725 | 5,256 | ||||||||||||||
| Guaranty ($2,000)(D) |
— | — | ||||||||||||||
|
|
|
|
|
|||||||||||||
| 11,725 | 9,256 | |||||||||||||||
| Diligent Delivery Systems |
Cargo Transport |
Secured Second Lien Term Debt (10.0%, Due 8/2020)(K) |
13,000 | 13,000 | 13,292 | |||||||||||
| Common Stock Warrants (8% ownership)(C)(L) |
500 | 2,598 | ||||||||||||||
|
|
|
|
|
|||||||||||||
| 13,500 | 15,890 | |||||||||||||||
| Drew Foam Companies, Inc. |
Chemicals, Plastics, and Rubber |
Secured First Lien Term Debt (13.5%, Due 8/2017)(L) |
9,913 | 9,913 | 9,913 | |||||||||||
| Preferred Stock
(34,045 |
3,375 | 3,878 | ||||||||||||||
| Common Stock (5,372 |
63 | 11,451 | ||||||||||||||
|
|
|
|
|
|||||||||||||
| 13,351 | 25,242 | |||||||||||||||
| Frontier Packaging, Inc. |
Containers, Packaging, and Glass |
Secured First Lien Term Debt (12.0%, Due 12/2019)(L) |
9,500 | 9,500 | 9,500 | |||||||||||
| Preferred Stock
(1,373 |
1,373 | 1,401 | ||||||||||||||
| Common Stock (152 |
152 | 7,364 | ||||||||||||||
|
|
|
|
|
|||||||||||||
| 11,025 | 18,265 | |||||||||||||||
| Funko Acquisition Holdings, LLC(M) |
Personal and Non-Durable Consumer Products (Manufacturing Only) |
Preferred Stock (260 units)(C)(L) |
167 | 257 | ||||||||||||
| Common Stock (975 units)(C)(L) |
— | — | ||||||||||||||
|
|
|
|
|
|||||||||||||
| 167 | 257 | |||||||||||||||
| Ginsey Home Solutions, Inc. |
Home and Office Furnishings, Housewares, and Durable Consumer Products |
Secured Second Lien Term Debt (13.5%, Due 1/2021)(H)(L) |
13,300 | 13,300 | 13,300 | |||||||||||
| Preferred Stock
(19,280 |
9,583 | 7,176 | ||||||||||||||
| Common Stock
(63,747 |
8 | — | ||||||||||||||
|
|
|
|
|
|||||||||||||
| 22,891 | 20,476 | |||||||||||||||
| Jackrabbit, Inc. |
Farming and Agriculture |
Secured First Lien Term Debt (13.5%, Due 4/2018)(L) |
11,000 | 11,000 | 11,000 | |||||||||||
| Preferred Stock
(3,556 |
3,556 | 3,421 | ||||||||||||||
| Common Stock (548 |
94 | — | ||||||||||||||
|
|
|
|
|
|||||||||||||
| 14,650 | 14,421 | |||||||||||||||
| Mathey Investments, Inc. |
Machinery (Non-agriculture, Non-construction, Non-electronic) |
Secured First Lien Term Debt (10.0%, Due 3/2018)(L) |
1,375 | 1,375 | 1,375 | |||||||||||
| Secured First Lien Term Debt (12.0%, Due 3/2018)(L) |
3,727 | 3,727 | 3,727 | |||||||||||||
| Secured First Lien Term Debt (12.5%, Due 3/2018)(E)(I)(L) |
3,500 | 3,500 | 1,619 | |||||||||||||
| Common Stock
(29,102 |
777 | — | ||||||||||||||
|
|
|
|
|
|||||||||||||
| 9,379 | 6,721 | |||||||||||||||
| Mitchell Rubber Products, Inc. |
Chemicals, Plastics, and Rubber |
Secured Second Lien Term Debt (13.0%, Due 3/2018)(I)(J)(Q) |
13,560 | 13,560 | 15,230 | |||||||||||
| Preferred Stock
(27,900 |
2,790 | 3,903 | ||||||||||||||
| Common Stock
(27,900 |
28 | 28 | ||||||||||||||
|
|
|
|
|
|||||||||||||
| 16,378 | 19,161 | |||||||||||||||
THE ACCOMPANYING NOTES ARE AN INTEGRAL PART OF THESE CONSOLIDATED FINANCIAL STATEMENTS.
70
GLADSTONE INVESTMENT CORPORATION
CONSOLIDATED SCHEDULE OF INVESTMENTS (Continued)
MARCH 31, 2017
(DOLLAR AMOUNTS IN THOUSANDS)
| Company(A) |
Industry |
Investment(B)(F) |
Principal | Cost | Fair Value | |||||||||||
|
|
|
|
|
|
|
|
|
|||||||||
| Nth Degree, Inc. | Diversified/Conglomerate Service |
Secured First Lien Term Debt (12.5%, Due 12/2020)(L) |
$ | 13,290 | $ | 13,290 | $ | 13,290 | ||||||||
| Preferred Stock
(5,660 |
5,660 | 12,471 | ||||||||||||||
|
|
|
|
|
|||||||||||||
| 18,950 | 25,761 | |||||||||||||||
| SBS Industries, LLC | Machinery (Non-agriculture, Non-construction, Non-electronic) |
Secured First Lien Term Debt (14.0%, Due 8/2019)(L) |
11,355 | 11,355 | 10,561 | |||||||||||
| Preferred Stock
(19,935 |
1,994 | — | ||||||||||||||
| Common Stock (221,500 shares)(C)(L) |
222 | — | ||||||||||||||
|
|
|
|
|
|||||||||||||
| 13,571 | 10,561 | |||||||||||||||
| Schylling, Inc. | Leisure, Amusement, Motion Pictures, and Entertainment |
Secured First Lien Term Debt (13.0%, Due 8/2018)(L) |
13,081 | 13,081 | 13,081 | |||||||||||
| Preferred Stock
(4,000 |
4,000 | 262 | ||||||||||||||
|
|
|
|
|
|||||||||||||
| 17,081 | 13,343 | |||||||||||||||
| Star Seed, Inc. | Farming and Agriculture |
Secured First Lien Term Debt (12.5%, Due 5/2018)(E)(K) |
5,000 | 5,000 | 4,675 | |||||||||||
| Preferred Stock
(1,499 |
1,499 | — | ||||||||||||||
| Common Stock (600 |
1 | — | ||||||||||||||
|
|
|
|
|
|||||||||||||
| 6,500 | 4,675 | |||||||||||||||
| Tread Corporation | Oil and Gas |
Secured First Lien Line of Credit, $634 available (12.5%, Due 2/2018)(G)(L) |
3,216 | 3,216 | 2,017 | |||||||||||
| Preferred Stock (12,998,639 shares)(C)(L) |
3,768 | — | ||||||||||||||
| Common Stock (10,089,048 shares)(C)(L) |
753 | — | ||||||||||||||
|
|
|
|
|
|||||||||||||
| 7,737 | 2,017 | |||||||||||||||
|
|
|
|
|
|||||||||||||
| Total Non-Control/Non-Affiliate Investments (represents 44.5% of total investments at fair value) |
$ | 225,046 | $ | 223,451 | ||||||||||||
|
|
|
|
|
|||||||||||||
| AFFILIATE INVESTMENTS(O): |
||||||||||||||||
| Alloy Die Casting Co.(M) | Diversified/Conglomerate Manufacturing |
Secured First Lien Term Debt (13.5%, Due
|
$ | 12,215 | $ | 12,215 | $ | 9,772 | ||||||||
| Secured First Lien Term Debt (13.5%, Due 10/2018)(G)(K) |
175 | 175 | 140 | |||||||||||||
| Secured First Lien Term Debt (Due 10/2018)(K)(R) |
910 | 910 | 732 | |||||||||||||
| Preferred Stock
(4,904 |
4,904 | — | ||||||||||||||
| Common Stock (630 |
41 | — | ||||||||||||||
|
|
|
|
|
|||||||||||||
| 18,245 | 10,644 | |||||||||||||||
| Brunswick Bowling Products, Inc. |
Home and Office Furnishings, Housewares and Durable Consumer Products |
Secured First Lien Term Debt (16.3%, Due 5/2020)(L) |
11,307 | 11,307 | 11,307 | |||||||||||
| Preferred Stock
(4,943 |
4,943 | 11,329 | ||||||||||||||
|
|
|
|
|
|||||||||||||
| 16,250 | 22,636 | |||||||||||||||
| B+T Group Acquisition Inc.(M) | Telecommunications |
Secured First Lien Term Debt (13.0%, Due 12/2019)(L) |
14,000 | 14,000 | 14,000 | |||||||||||
| Preferred Stock
(12,841 |
4,196 | — | ||||||||||||||
|
|
|
|
|
|||||||||||||
| 18,196 | 14,000 | |||||||||||||||
| Cambridge Sound Management, Inc. |
Home and Office Furnishings, Housewares and Durable Consumer Products |
Secured Second Lien Term Debt (13.0%, Due 8/2021)(L) |
16,000 | 16,000 | 16,000 | |||||||||||
| Preferred Stock
(4,500 |
4,500 | 11,046 | ||||||||||||||
|
|
|
|
|
|||||||||||||
| 20,500 | 27,046 | |||||||||||||||
| Channel Technologies Group, LLC |
Diversified/Conglomerate Manufacturing |
Preferred Stock
(2,279 |
1,841 | — | ||||||||||||
| Common Stock (2,319,184 shares)(C)(L) |
— | — | ||||||||||||||
|
|
|
|
|
|||||||||||||
| 1,841 | — | |||||||||||||||
THE ACCOMPANYING NOTES ARE AN INTEGRAL PART OF THESE CONSOLIDATED FINANCIAL STATEMENTS.
71
GLADSTONE INVESTMENT CORPORATION
CONSOLIDATED SCHEDULE OF INVESTMENTS (Continued)
MARCH 31, 2017
(DOLLAR AMOUNTS IN THOUSANDS)
| Company(A) |
Industry |
Investment(B)(F) |
Principal | Cost | Fair Value | |||||||||||
|
|
|
|
|
|
|
|
|
|||||||||
| D.P.M.S., Inc. | Diversified/Conglomerate Manufacturing |
Secured First Lien Term Debt (10.0%, Due 10/2021)(I)(L) |
$ | 8,796 | $ | 8,796 | $ | 7,175 | ||||||||
| Common Stock (627 |
1 | — | ||||||||||||||
|
|
|
|
|
|||||||||||||
| 8,797 | 7,175 | |||||||||||||||
| Edge Adhesives Holdings, Inc. (M) |
Diversified/Conglomerate Manufacturing |
Secured First Lien Term Debt (12.5%, Due 2/2019)(K) |
9,300 | 9,300 | 9,207 | |||||||||||
| Secured First Lien Term Debt (13.8%, Due 2/2019)(K) |
2,400 | 2,400 | 2,388 | |||||||||||||
| Preferred Stock
(3,774 |
3,774 | 1,271 | ||||||||||||||
|
|
|
|
|
|||||||||||||
| 15,474 | 12,866 | |||||||||||||||
| GI Plastek, Inc. | Chemicals, Plastics, and Rubber |
Secured First Lien Term Debt (13.3%, Due 7/2020)(L) |
15,000 | 15,000 | 15,000 | |||||||||||
| Preferred Stock
(5,150 |
5,150 | 5,754 | ||||||||||||||
|
|
|
|
|
|||||||||||||
| 20,150 | 20,754 | |||||||||||||||
| Head Country, Inc. | Beverage, Food and Tobacco |
Secured First Lien Term Debt (12.5%, Due 2/2019)(L) |
9,050 | 9,050 | 9,050 | |||||||||||
| Preferred Stock (4,000 shares)(C)(L) |
4,000 | 5,752 | ||||||||||||||
|
|
|
|
|
|||||||||||||
| 13,050 | 14,802 | |||||||||||||||
| JR Hobbs, Co. – Atlanta, LLC | Diversified/Conglomerate Services |
Secured First Lien Line of Credit, $1,050 available (10.0% (1.0% Unused Fee), Due 2/2018)(T) |
2,950 | 2,950 | 2,950 | |||||||||||
| Secured First Lien Term Debt (13.0%, Due 2/2022)(T) |
21,000 | 21,000 | 21,000 | |||||||||||||
| Preferred Stock (5,920 shares)(C)(T) |
5,920 | 5,920 | ||||||||||||||
|
|
|
|
|
|||||||||||||
| 29,870 | 29,870 | |||||||||||||||
| Logo Sportswear, Inc. |
Textiles and Leather |
Secured First Lien Term Debt (12.5%, Due 3/2020)(L) |
9,200 | 9,200 | 9,200 | |||||||||||
| Preferred Stock (1,550 shares)(C)(L) |
1,550 | 11,170 | ||||||||||||||
|
|
|
|
|
|||||||||||||
| 10,750 | 20,370 | |||||||||||||||
| Meridian Rack & Pinion, Inc.(M) |
Automobile |
Secured First Lien Term Debt (13.5%, Due 12/2018)(K) |
9,660 | 9,660 | 8,646 | |||||||||||
| Preferred Stock (3,381 shares)(C)(L) |
3,381 | 2,890 | ||||||||||||||
|
|
|
|
|
|||||||||||||
| 13,041 | 11,536 | |||||||||||||||
| The Mountain Corporation | Personal and Non-Durable Consumer Products (Manufacturing Only) |
Secured Second Lien Term Debt (13.5%,
Due |
18,600 | 18,600 | 18,600 | |||||||||||
| Preferred Stock (6,899 shares)(C)(L) |
6,899 | 153 | ||||||||||||||
| Common Stock (751 |
1 | — | ||||||||||||||
|
|
|
|
|
|||||||||||||
| 25,500 | 18,753 | |||||||||||||||
| NDLI, Inc. | Cargo Transport |
Preferred Stock (3,600 shares)(C)(L) |
3,600 | — | ||||||||||||
| Common Stock (545 |
— | — | ||||||||||||||
|
|
|
|
|
|||||||||||||
| 3,600 | — | |||||||||||||||
| Old World Christmas, Inc. | Home and Office Furnishings, Housewares, and Durable Consumer Products |
Secured First Lien Term Debt (13.3%, Due 10/2019)(L) |
15,770 | 15,770 | 15,770 | |||||||||||
| Preferred Stock (6,180 shares)(C)(L) |
6,180 | 7,135 | ||||||||||||||
|
|
|
|
|
|||||||||||||
| 21,950 | 22,905 | |||||||||||||||
| Precision Southeast, Inc. | Diversified/Conglomerate Manufacturing |
Secured Second Lien Term Debt (14.0%,
Due |
9,618 | 9,618 | 9,618 | |||||||||||
| Preferred Stock (37,391 shares)(C)(L) |
3,739 | — | ||||||||||||||
| Common Stock (90,909 shares)(C)(L) |
91 | — | ||||||||||||||
|
|
|
|
|
|||||||||||||
| 13,448 | 9,618 | |||||||||||||||
| SOG Specialty Knives & Tools, LLC |
Leisure, Amusement, Motion Pictures, and Entertainment |
Secured First Lien Term Debt (13.3%, Due 10/2017)(L) |
6,200 | 6,200 | 6,200 | |||||||||||
| Secured First Lien Term Debt (14.8%, Due 10/2017)(L) |
12,200 | 12,200 | 12,200 | |||||||||||||
| Preferred Stock (9,749 shares)(C)(L) |
9,749 | 711 | ||||||||||||||
|
|
|
|
|
|||||||||||||
| 28,149 | 19,111 | |||||||||||||||
|
|
|
|
|
|||||||||||||
| Total Affiliate Investments (represents 52.3% of total investments at fair value) |
|
$ | 278,811 | $ | 262,086 | |||||||||||
|
|
|
|
|
|||||||||||||
THE ACCOMPANYING NOTES ARE AN INTEGRAL PART OF THESE CONSOLIDATED FINANCIAL STATEMENTS.
72
GLADSTONE INVESTMENT CORPORATION
CONSOLIDATED SCHEDULE OF INVESTMENTS (Continued)
MARCH 31, 2017
(DOLLAR AMOUNTS IN THOUSANDS)
| Company(A) |
Industry |
Investment(B)(F) |
Principal | Cost | Fair Value | |||||||||||
| CONTROL INVESTMENTS(P): |
|
|||||||||||||||
| Galaxy Tool Holding Corporation | Aerospace and Defense |
Secured First Lien Line of Credit, $200 available (6.5% (1.0%
Unused Fee), Due |
$ | 4,800 | $ | 4,800 | $ | 4,800 | ||||||||
| Secured Second Lien Term Debt (10.0%,
Due |
5,000 | 5,000 | 5,000 | |||||||||||||
| Preferred Stock
(5,517,444 |
11,464 | 6,242 | ||||||||||||||
| Common Stock
(88,843 |
48 | — | ||||||||||||||
|
|
|
|
|
|||||||||||||
| 21,312 | 16,042 | |||||||||||||||
|
|
|
|
|
|||||||||||||
| Total Control Investments (represents 3.2% of total investments at fair value) |
|
$ | 21,312 | $ | 16,042 | |||||||||||
|
|
|
|
|
|||||||||||||
| TOTAL INVESTMENTS(U) |
$ | 525,169 | $ | 501,579 | ||||||||||||
|
|
|
|
|
|||||||||||||
| (A) | Certain of the securities listed are issued by affiliate(s) of the indicated portfolio company. The majority of the securities listed, totaling $448.0 million at fair value, are pledged as collateral to our revolving line of credit as described further in Note 5 — Borrowings. Additionally, under Section 55 of the Investment Company Act of 1940, as amended, (the “1940 Act”), we may not acquire any non-qualifying assets unless, at the time such acquisition is made, qualifying assets represent at least 70% of our total assets. As of March 31, 2017, our investment in AquaVenture Holdings Limited is considered a non-qualifying asset under Section 55 of the 1940 Act and represents 0.7% of total investments, at fair value. |
| (B) | Percentages represent the weighted average cash interest rates in effect at March 31, 2017, and due date represents the contractual maturity date. Unless indicated otherwise, all cash interest rates are indexed to 30-day London Interbank Offered Rate. If applicable, paid-in-kind interest rates are noted separately from the cash interest rates. |
| (C) | Security is non-income producing. |
| (D) | Refer to Note 11 — Commitments and Contingencies for additional information regarding this guaranty. |
| (E) | Last Out Tranche (“LOT”) of secured first lien debt, meaning if the portfolio company is liquidated, the holder of the LOT generally is paid after the other secured first lien debt but before the secured second lien debt. |
| (F) | Where applicable, aggregates all shares of a class of stock owned without regard to specific series owned within such class (some series of which may or may not be voting shares) or aggregates all warrants to purchase shares of a class of stock owned without regard to specific series of such class of stock such warrants allow us to purchase. |
| (G) | Debt security is on non-accrual status. |
| (H) | $5.1 million of the debt security was participated to a third party, but is accounted for as collateral for a secured borrowing under accounting principles generally accepted in the U.S. and presented as Secured borrowing on our accompanying Consolidated Statements of Assets and Liabilities as of March 31, 2017. |
| (I) | Debt security has a fixed interest rate. |
| (J) | Security was sold subsequent to March 31, 2017. Refer to Note 15 — Subsequent Events for additional information. |
| (K) | Fair value was based on internal yield analysis or on estimates of value submitted by Standard & Poor’s Securities Evaluations, Inc. Refer to Note 3 — Investments for additional information. |
| (L) | Fair value was based on the total enterprise value of the portfolio company, which is generally allocated to the portfolio company’s securities in order of their relative priority in the capital structure. Refer to Note 3 — Investments for additional information. |
| (M) | One of our affiliated funds, Gladstone Capital Corporation, co-invested with us in this portfolio company pursuant to an exemptive order granted by the U.S. Securities and Exchange Commission. |
| (N) | Non-Control/Non-Affiliate investments, as defined by the 1940 Act, are those that are neither Control nor Affiliate investments and in which we own less than 5.0% of the issued and outstanding voting securities. |
| (O) | Affiliate investments, as defined by the 1940 Act, are those that are not Control investments and in which we own, with the power to vote, between and inclusive of 5.0% and 25.0% of the issued and outstanding voting securities. |
| (P) | Control investments, as defined by the 1940 Act, are those where we have the power to exercise a controlling influence over the management or policies of the portfolio company, which may include owning, with the power to vote, more than 25.0% of the issued and outstanding voting securities. |
| (Q) | Fair value was based on the expected exit or payoff amount, where such event has occurred or is expected to occur imminently. |
| (R) | Debt security does not have a stated current interest rate. |
| (S) | Fair value was based on the closing market price of our shares as of the reporting date less a discount for lack of marketability. |
| (T) | New portfolio investment valued at cost, as it was determined that the price paid during the three months ended March 31, 2017 best represents fair value as of March 31, 2017. |
| (U) | Cumulative gross unrealized depreciation for federal income tax purposes is $77.9 million; cumulative gross unrealized appreciation for federal income tax purposes is $58.3 million. Cumulative net unrealized depreciation is $19.5 million, based on a tax cost of $521.1 million. |
THE ACCOMPANYING NOTES ARE AN INTEGRAL PART OF THESE CONSOLIDATED FINANCIAL STATEMENTS.
73
GLADSTONE INVESTMENT CORPORATION
CONSOLIDATED SCHEDULE OF INVESTMENTS
MARCH 31, 2016
(DOLLAR AMOUNTS IN THOUSANDS)
| Company(A) |
Industry |
Investment(B)(F) |
Principal | Cost | Fair Value |
|||||||||||
|
NON-CONTROL/NON-AFFILIATE INVESTMENTS(N): |
| |||||||||||||||
| Auto Safety House, LLC | Automobile |
Secured First Lien Line of Credit, $1,000 available (8.0%, Due 10/2019)(I)(Q) |
$ | — | $ | — | $ | — | ||||||||
| Secured First Lien Term Debt (8.0%, Due 10/2019)(I)(Q) |
5,000 | 5,000 | 5,311 | |||||||||||||
|
|
|
|
|
|||||||||||||
| 5,000 | 5,311 | |||||||||||||||
| B-Dry, LLC | Personal, Food and Miscellaneous Services |
Secured First Lien Line of Credit, $500 available (6.7% (0.8% Unused Fee), Due 12/2016)(L) |
3,500 | 3,500 | 3,500 | |||||||||||
| Secured First Lien Term Debt (12.0%, Due 12/2019)(L) |
6,433 | 6,443 | 1,191 | |||||||||||||
| Secured First Lien Term Debt (12.0%, Due 12/2019)(L) |
840 | 840 | — | |||||||||||||
| Preferred Stock (2,500 shares)(C)(L) |
2,516 | — | ||||||||||||||
| Common Stock (2,500 shares)(C)(L) |
300 | — | ||||||||||||||
|
|
|
|
|
|||||||||||||
| 13,599 | 4,691 | |||||||||||||||
| Country Club Enterprises, LLC | Automobile |
Secured Second Lien Term Debt (18.7%, Due 5/2017)(L) |
4,000 | 4,000 | 4,000 | |||||||||||
| Preferred Stock (7,245,681 shares)(C)(L) |
7,725 | 5,313 | ||||||||||||||
| Guaranty ($2,000)(D) |
— | — | ||||||||||||||
| Guaranty ($279)(D) |
— | — | ||||||||||||||
|
|
|
|
|
|||||||||||||
| 11,725 | 9,313 | |||||||||||||||
| Diligent Delivery Systems | Cargo Transport |
Secured Second Lien Term Debt (10.0%, Due 8/2020)(K) |
13,000 | 13,000 | 12,984 | |||||||||||
| Common Stock Warrants (6.0% ownership)(C)(L) |
— | 1,500 | ||||||||||||||
|
|
|
|
|
|||||||||||||
| 13,000 | 14,484 | |||||||||||||||
| Drew Foam Companies, Inc. | Chemicals, Plastics, and Rubber |
Secured First Lien Term Debt (13.5%, Due 8/2017)(L) |
9,913 | 9,913 | 9,913 | |||||||||||
| Preferred Stock (34,045 shares)(C)(L) |
3,375 | 3,583 | ||||||||||||||
| Common Stock (5,372 shares)(C)(L) |
63 | 6,459 | ||||||||||||||
|
|
|
|
|
|||||||||||||
| 13,351 | 19,955 | |||||||||||||||
| Frontier Packaging, Inc. | Containers, Packaging, and Glass |
Secured First Lien Term Debt (12.0%, Due 12/2017)(L) |
10,500 | 10,500 | 10,500 | |||||||||||
| Preferred Stock (1,373 shares)(C)(L) |
1,373 | 1,386 | ||||||||||||||
| Common Stock (152 |
152 | 8,222 | ||||||||||||||
|
|
|
|
|
|||||||||||||
| 12,025 | 20,108 | |||||||||||||||
| Funko Acquisition Holdings, LLC(M) |
Personal and Non-Durable Consumer Products (Manufacturing Only) |
Preferred Stock (260 |
260 | 315 | ||||||||||||
| Common Stock (975 |
— | — | ||||||||||||||
|
|
|
|
|
|||||||||||||
| 260 | 315 | |||||||||||||||
| Ginsey Home Solutions, Inc. | Home and Office Furnishings, Housewares, and Durable Consumer Products |
Secured Second Lien Term Debt (13.5%, Due 1/2018)(H)(L) |
13,300 | 13,300 | 13,300 | |||||||||||
| Preferred Stock (19,280 shares)(C)(L) |
9,583 | 4,813 | ||||||||||||||
| Common Stock (63,747 shares)(C)(L) |
8 | — | ||||||||||||||
|
|
|
|
|
|||||||||||||
| 22,891 | 18,113 | |||||||||||||||
| Jackrabbit, Inc. | Farming and Agriculture |
Secured First Lien Term Debt (13.5%, Due 4/2018)(L) |
11,000 | 11,000 | 11,000 | |||||||||||
| Preferred Stock (3,556 shares)(C)(L) |
3,556 | 4,471 | ||||||||||||||
| Common Stock (548 |
94 | 934 | ||||||||||||||
|
|
|
|
|
|||||||||||||
| 14,650 | 16,405 | |||||||||||||||
| Mathey Investments, Inc. | Machinery (Non-agriculture, Non-construction, Non-electronic) |
Secured First Lien Term Debt (10.0%, Due 3/2018)(L) |
1,375 | 1,375 | 1,375 | |||||||||||
| Secured First Lien Term Debt (12.0%, Due 3/2018)(L) |
3,727 | 3,727 | 3,727 | |||||||||||||
| Secured First Lien Term Debt (12.5%, Due 3/2018)(E)(I)(L) |
3,500 | 3,500 | 3,500 | |||||||||||||
| Common Stock (29,102 shares)(C)(L) |
777 | 54 | ||||||||||||||
|
|
|
|
|
|||||||||||||
| 9,379 | 8,656 | |||||||||||||||
| Mitchell Rubber Products, Inc. | Chemicals, Plastics, and Rubber |
Secured Second Lien Term Debt (13.0%, Due 10/2016)(I)(K) |
13,560 | 13,560 | 5,082 | |||||||||||
| Preferred Stock (27,900 shares)(C)(L) |
2,790 | — | ||||||||||||||
| Common Stock (27,900 shares)(C)(L) |
28 | — | ||||||||||||||
|
|
|
|
|
|||||||||||||
| 16,378 | 5,082 | |||||||||||||||
| Nth Degree, Inc. | Diversified/Conglomerate Service |
Secured First Lien Term Debt (12.5%, Due 12/2020)(L) |
13,290 | 13,290 | 13,290 | |||||||||||
| Preferred Equity (5,660 units)(C)(L) |
5,660 | 7,712 | ||||||||||||||
|
|
|
|
|
|||||||||||||
| 18,950 | 21,002 | |||||||||||||||
THE ACCOMPANYING NOTES ARE AN INTEGRAL PART OF THESE CONSOLIDATED FINANCIAL STATEMENTS.
74
GLADSTONE INVESTMENT CORPORATION
CONSOLIDATED SCHEDULE OF INVESTMENTS (Continued)
MARCH 31, 2016
(DOLLAR AMOUNTS IN THOUSANDS)
| Company(A) |
Industry |
Investment(B)(F) |
Principal | Cost | Fair Value | |||||||||||
|
|
|
|
|
|
|
|
|
|||||||||
| Quench Holdings Corp. | Home and Office Furnishings, Housewares, and Durable Consumer Products |
Common Stock (4,770,391 shares)(C)(L) |
$ | $ | 3,397 | $ | 4,359 | |||||||||
|
|
|
|
|
|||||||||||||
| 3,397 | 4,359 | |||||||||||||||
| SBS Industries, LLC | Machinery (Non-agriculture, Non-construction, Non-electronic) |
Secured First Lien Term Debt (14.0%, Due 8/2019)(L) |
11,355 | 11,355 | 11,355 | |||||||||||
| Preferred Stock
(19,935 |
1,994 | — | ||||||||||||||
| Common Stock (221,500 shares)(C)(L) |
222 | — | ||||||||||||||
|
|
|
|
|
|||||||||||||
| 13,571 | 11,355 | |||||||||||||||
| Schylling, Inc. | Leisure, Amusement, Motion Pictures, Entertainment |
Secured First Lien Term Debt (13.0%, Due 8/2018)(L) |
13,081 | 13,081 | 13,081 | |||||||||||
| Preferred Stock
(4,000 |
4,000 | 4,103 | ||||||||||||||
|
|
|
|
|
|||||||||||||
| 17,081 | 17,184 | |||||||||||||||
| Star Seed, Inc. | Farming and Agriculture |
Secured First Lien Term Debt (12.5%,
Due |
5,000 | 5,000 | 4,600 | |||||||||||
| Preferred Stock
(1,499 |
1,499 | — | ||||||||||||||
| Common Stock (600 |
1 | — | ||||||||||||||
|
|
|
|
|
|||||||||||||
| 6,500 | 4,600 | |||||||||||||||
|
|
|
|
|
|||||||||||||
| Total Non-Control/Non-Affiliate Investments (represents 37.1% of total investments at fair value) |
|
$ | 191,757 | $ | 180,933 | |||||||||||
|
|
|
|
|
|||||||||||||
| AFFILIATE INVESTMENTS(O): |
||||||||||||||||
| Acme Cryogenics, Inc. | Chemicals, Plastics, and Rubber |
Secured Second Lien Term Debt (11.5%,
Due |
$ | 14,500 | $ | 14,500 | $ | 14,500 | ||||||||
| Preferred Stock (965,982 shares)(C)(Q) |
7,956 | 22,337 | ||||||||||||||
| Common Stock (549,908 shares)(C)(Q) |
1,197 | 4,201 | ||||||||||||||
| Common Stock Warrants (465,639 shares)(C)(Q) |
25 | 3,856 | ||||||||||||||
|
|
|
|
|
|||||||||||||
| 23,678 | 44,894 | |||||||||||||||
| Alloy Die Casting Corp.(M) | Diversified/Conglomerate Manufacturing |
Secured First Lien Term Debt (13.5%, Due 10/2018)(K) |
12,215 | 12,215 | 11,390 | |||||||||||
| Preferred Stock
(4,064 |
4,064 | 612 | ||||||||||||||
| Common Stock (630 |
41 | — | ||||||||||||||
|
|
|
|
|
|||||||||||||
| 16,320 | 12,002 | |||||||||||||||
| Behrens Manufacturing, LLC(M) | Diversified/Conglomerate Manufacturing |
Secured First Lien Term Debt (13.0%, Due 12/2018)(L) |
9,975 | 9,975 | 9,975 | |||||||||||
| Preferred Stock
(2,923 |
2,922 | 8,593 | ||||||||||||||
|
|
|
|
|
|||||||||||||
| 12,897 | 18,568 | |||||||||||||||
| Brunswick Bowling Products, Inc. |
Home and Office Furnishings, Housewares and Durable Consumer Products |
Secured First Lien Term Debt (16.3%, Due 5/2020)(L) |
11,307 | 11,307 | 11,307 | |||||||||||
| Preferred Stock
(4,943 |
4,943 | 5,267 | ||||||||||||||
|
|
|
|
|
|||||||||||||
| 16,250 | 16,574 | |||||||||||||||
| B+T Group Acquisition, Inc.(M) | Telecommunications |
Secured First Lien Term Debt (13.0%, Due 12/2019)(L) |
14,000 | 14,000 | 14,000 | |||||||||||
| Preferred Stock
(12,841 |
4,196 | — | ||||||||||||||
|
|
|
|
|
|||||||||||||
| 18,196 | 14,000 | |||||||||||||||
| Cambridge Sound Management, Inc. |
Home and Office Furnishing, Housewares and Durable Consumer Products |
Secured First Lien Term Debt (13.0%, Due 9/2019)(L) |
15,000 | 15,000 | 15,000 | |||||||||||
| Preferred Stock
(4,500 |
4,500 | 12,835 | ||||||||||||||
|
|
|
|
|
|||||||||||||
| 19,500 | 27,835 | |||||||||||||||
| Channel Technologies Group, LLC |
Diversified/Conglomerate Manufacturing |
Preferred Stock
(2,319 |
2,938 | 989 | ||||||||||||
| Common Stock (2,319,184 shares)(C)(L) |
— | — | ||||||||||||||
|
|
|
|
|
|||||||||||||
| 2,938 | 989 | |||||||||||||||
| Counsel Press, Inc. | Diversified/Conglomerate Services |
Secured First Lien Line of Credit, $1,000 available (12.8% (1% Unused Fee), Due 3/2017)(L) |
— | — | — | |||||||||||
| Secured First Lien Term Debt (12.8%, Due 3/2020)(L) |
18,000 | 18,000 | 18,000 | |||||||||||||
| Secured First Lien Term Debt (14.0%, Due 3/2020)(L) |
5,500 | 5,500 | 5,500 | |||||||||||||
| Preferred Stock
(6,995 |
6,995 | 5,399 | ||||||||||||||
|
|
|
|
|
|||||||||||||
| 30,495 | 28,899 | |||||||||||||||
THE ACCOMPANYING NOTES ARE AN INTEGRAL PART OF THESE CONSOLIDATED FINANCIAL STATEMENTS.
75
GLADSTONE INVESTMENT CORPORATION
CONSOLIDATED SCHEDULE OF INVESTMENTS (Continued)
MARCH 31, 2016
(DOLLAR AMOUNTS IN THOUSANDS)
| Company(A) |
Industry | Investment(B)(F) | Principal | Cost | Fair Value | |||||||||||
|
|
|
|
|
|
|
|
|
|||||||||
| D.P.M.S., Inc. |
Diversified/Conglomerate Manufacturing |
Secured First Lien Line of Credit, $550 available (4.0% (0.5% Unused Fee), Due 8/2017)(I)(L) |
$ | 4,000 | $ | 4,000 | $ | 4,000 | ||||||||
| Secured First Lien Term Debt (4.0%, Due 8/2017)(I)(L) |
2,575 | 2,575 | 2,575 | |||||||||||||
| Secured First Lien Term Debt (4.0%, Due 8/2017)(I)(L) |
8,795 | 8,795 | 2,073 | |||||||||||||
| Secured First Lien Term Debt (5.2%, Due 8/2017)(E)(L) |
1,150 | 1,150 | — | |||||||||||||
| Preferred Stock (25 |
2,500 | — | ||||||||||||||
| Common Stock (1,241 shares)(C)(L) |
3 | — | ||||||||||||||
|
|
|
|
|
|||||||||||||
| 19,023 | 8,648 | |||||||||||||||
| Edge Adhesives Holdings, |
Diversified/Conglomerate Manufacturing |
Secured First Lien Term Debt (12.5%, Due 2/2019)(K) |
9,300 | 9,300 | 8,928 | |||||||||||
| Secured First Lien Term Debt (13.8%, Due 2/2019)(K) |
2,400 | 2,400 | 2,310 | |||||||||||||
| Preferred Stock
(3,774 |
3,774 | — | ||||||||||||||
|
|
|
|
|
|||||||||||||
| 15,474 | 11,238 | |||||||||||||||
| GI Plastek, Inc. |
Chemicals, Plastics, and Rubber |
Secured First Lien Term Debt (13.3%, Due 7/2020)(L) |
15,000 | 15,000 | 15,000 | |||||||||||
| Preferred Stock
(5,150 |
5,150 | 5,672 | ||||||||||||||
|
|
|
|
|
|||||||||||||
| 20,150 | 20,672 | |||||||||||||||
| Head Country, Inc. |
Beverage, Food and Tobacco |
Secured First Lien Term Debt (12.5%, Due 2/2019)(L) |
9,050 | 9,050 | 9,050 | |||||||||||
| Preferred Stock (4,000 shares)(C)(L) |
4,000 | — | ||||||||||||||
|
|
|
|
|
|||||||||||||
| 13,050 | 9,050 | |||||||||||||||
| Logo Sportswear, Inc. |
Textiles and Leather |
Secured First Lien Term Debt (12.5%, Due 3/2020)(L) |
9,200 | 9,200 | 9,200 | |||||||||||
| Preferred Stock (1,550 shares)(C)(L) |
1,550 | 2,795 | ||||||||||||||
|
|
|
|
|
|||||||||||||
| 10,750 | 11,995 | |||||||||||||||
| Meridian Rack & Pinion, |
Automobile |
Secured First Lien Term Debt (13.5%, Due 12/2018)(K) |
9,660 | 9,660 | 8,791 | |||||||||||
| Preferred Stock (3,381 shares)(C)(L) |
3,381 | 988 | ||||||||||||||
|
|
|
|
|
|||||||||||||
| 13,041 | 9,779 | |||||||||||||||
| NDLI, Inc. |
Cargo Transport |
Preferred Stock (3,600 shares)(C)(L) |
3,600 | — | ||||||||||||
| Common Stock (545 |
— | — | ||||||||||||||
|
|
|
|
|
|||||||||||||
| 3,600 | — | |||||||||||||||
| Old World Christmas, Inc. |
Home and Office Furnishings, Housewares, and Durable Consumer Products |
Secured First Lien Term Debt (13.3%, Due 10/2019)(L) |
15,770 | 15,770 | 15,770 | |||||||||||
| Preferred Stock (6,180 shares)(C)(L) |
6,180 | 4,159 | ||||||||||||||
|
|
|
|
|
|||||||||||||
| 21,950 | 19,929 | |||||||||||||||
| Precision Southeast, Inc. |
Diversified/Conglomerate Manufacturing |
Secured Second Lien Term Debt (14.0%,
Due |
9,618 | 9,618 | 9,618 | |||||||||||
| Preferred Stock (37,391 shares)(C)(L) |
3,739 | 3,922 | ||||||||||||||
| Common Stock (90,909 shares)(C)(L) |
91 | — | ||||||||||||||
|
|
|
|
|
|||||||||||||
| 13,448 | 13,540 | |||||||||||||||
| SOG Specialty Knives & Tools, LLC |
Leisure, Amusement, Motion Pictures, Entertainment |
Secured First Lien Term Debt (13.3%, Due 10/2017)(L) |
6,200 | 6,200 | 6,200 | |||||||||||
| Secured First Lien Term Debt (14.8%, Due 10/2017)(L) |
12,200 | 12,200 | 12,200 | |||||||||||||
| Preferred Stock (9,749 shares)(C)(L) |
9,749 | 7,747 | ||||||||||||||
|
|
|
|
|
|||||||||||||
| 28,149 | 26,147 | |||||||||||||||
| Tread Corporation |
Oil and Gas |
Secured First Lien Line of Credit, $2,424 available (12.5%, Due 2/2018)(G)(L) |
1,426 | 1,426 | 1,426 | |||||||||||
| Preferred Stock (12,998,639 shares)(C)(L) |
3,768 | 538 | ||||||||||||||
| Common Stock (10,089,048 shares)(C)(L) |
753 | — | ||||||||||||||
|
|
|
|
|
|||||||||||||
| 5,947 | 1,964 | |||||||||||||||
|
|
|
|
|
|||||||||||||
| Total Affiliate Investments (represents 60.8% of total investments at fair value) |
|
$ | 304,856 | $ | 296,723 | |||||||||||
|
|
|
|
|
|||||||||||||
THE ACCOMPANYING NOTES ARE AN INTEGRAL PART OF THESE CONSOLIDATED FINANCIAL STATEMENTS.
76
GLADSTONE INVESTMENT CORPORATION
CONSOLIDATED SCHEDULE OF INVESTMENTS (Continued)
MARCH 31, 2016
(DOLLAR AMOUNTS IN THOUSANDS)
| Company(A) |
Industry |
Investment(B)(F) |
Principal | Cost | Fair Value | |||||||||||
| CONTROL INVESTMENTS(P): |
|
|||||||||||||||
| Galaxy Tool Holding Corporation |
Aerospace and Defense |
Secured First Lien Line of Credit, $0 available (6.5% (1.0% Unused Fee), Due 9/2016)(L) |
$ | 5,000 | $ | 5,000 | $ | 5,000 | ||||||||
| Secured Second Lien Term Debt (10.0%, Due 8/2017)(L) |
5,000 | 5,000 | 5,000 | |||||||||||||
| Preferred Stock (5,517,444 shares)(C)(L) |
11,464 | — | ||||||||||||||
| Common Stock (88,843 shares)(C)(L) |
48 | — | ||||||||||||||
|
|
|
|
|
|||||||||||||
| 21,512 | 10,000 | |||||||||||||||
|
|
|
|
|
|||||||||||||
| Total Control Investments (represents 2.1% of total investments at fair value) |
|
$ | 21,512 | $ | 10,000 | |||||||||||
|
|
|
|
|
|||||||||||||
| TOTAL INVESTMENTS(R) |
$ | 518,125 | $ | 487,656 | ||||||||||||
|
|
|
|
|
|||||||||||||
| (A) | Certain of the securities listed are issued by affiliate(s) of the indicated portfolio company. The majority of the securities listed, totaling $461.4 million at fair value, are pledged as collateral to our revolving line of credit as described further in Note 5 — Borrowings. Additionally, all of our investments are considered qualifying assets under Section 55 of the Investment Company Act of 1940, as amended, (the “1940 Act”) as of March 31, 2016. Under the 1940 Act, we may not acquire any non-qualifying assets unless, at the time such acquisition is made, qualifying assets represent at least 70% of our total assets. |
| (B) | Percentages represent the weighted average cash interest rates in effect at March 31, 2016, and due date represents the contractual maturity date. Unless indicated otherwise, all cash interest rates are indexed to 30-day London Interbank Offered Rate. If applicable, paid-in-kind interest rates are noted separately from the cash interest rates. |
| (C) | Security is non-income producing. |
| (D) | Refer to Note 11 — Commitments and Contingencies for additional information regarding these guaranties. |
| (E) | Last Out Tranche (“LOT”) of secured first lien debt, meaning if the portfolio company is liquidated, the holder of the LOT generally is paid after the other secured first lien debt but before the secured second lien debt. |
| (F) | Where applicable, aggregates all shares of such class of stock owned without regard to specific series owned within such class (some series of which may or may not be voting shares) or aggregates all warrants to purchase shares of such class of stock owned without regard to specific series of such class of stock such warrants allow us to purchase. |
| (G) | Debt security is on non-accrual status. |
| (H) | $5.1 million of the debt security was participated to a third party, but is accounted for as collateral for a secured borrowing under accounting principles generally accepted in the U.S. and presented as secured borrowing on our accompanying Consolidated Statements of Assets and Liabilities as of March 31, 2016. |
| (I) | Debt security has a fixed interest rate. |
| (J) | Reserved. |
| (K) | Fair value was based on internal yield analysis or on estimates of value submitted by Standard & Poor’s Securities Evaluations, Inc. Refer to Note 3 — Investments for additional information. |
| (L) | Fair value was based on the total enterprise value of the portfolio company, which is generally allocated to the portfolio company’s securities in order of their relative priority in the capital structure. Refer to Note 3 — Investments for additional information. |
| (M) | One of our affiliated funds, Gladstone Capital Corporation, co-invested with us in this portfolio company pursuant to an exemptive order granted by the U.S. Securities and Exchange Commission. |
| (N) | Non-Control/Non-Affiliate investments, as defined by the 1940 Act, are those that are neither Control nor Affiliate investments and in which we own less than 5.0% of the issued and outstanding voting securities. |
| (O) | Affiliate investments, as defined by the 1940 Act, are those that are not Control investments and in which we own, with the power to vote, between and inclusive of 5.0% and 25.0% of the issued and outstanding voting securities. |
| (P) | Control investments, as defined by the 1940 Act, are those where we have the power to exercise a controlling influence over the management or policies of the portfolio company, which may include owning, with the power to vote, more than 25.0% of the issued and outstanding voting securities. |
| (Q) | Fair value was based on the expected exit or payoff amount, where such event has occurred or is expected to occur imminently. |
| (R) | Cumulative gross unrealized depreciation for federal income tax purposes is $86.2 million; cumulative gross unrealized appreciation for federal income tax purposes is $60.4 million. Cumulative net unrealized depreciation is $25.8 million, based on a tax cost of $513.5 million. |
THE ACCOMPANYING NOTES ARE AN INTEGRAL PART OF THESE CONSOLIDATED FINANCIAL STATEMENTS.
77
GLADSTONE INVESTMENT CORPORATION
NOTES TO CONSOLIDATED FINANCIAL STATEMENTS
MARCH 31, 2017
(DOLLAR AMOUNTS IN THOUSANDS, EXCEPT SHARE AND PER SHARE DATA AND AS OTHERWISE
INDICATED)
NOTE 1. ORGANIZATION
Gladstone Investment Corporation (“Gladstone Investment”) was incorporated under the General Corporation Law of the State of Delaware on February 18, 2005, and completed an initial public offering on June 22, 2005. The terms “the Company,” “we,” “our” and “us” all refer to Gladstone Investment and its consolidated subsidiaries. We are an externally advised, closed-end, non-diversified management investment company that has elected to be treated as a business development company (“BDC”) under the Investment Company Act of 1940, as amended (the “1940 Act”), and is applying the guidance of Financial Accounting Standards Board (“FASB”) Accounting Standards Codification (“ASC”) Topic 946 Financial Services-Investment Companies (“ASC 946”). In addition, we have elected to be treated for tax purposes as a regulated investment company (“RIC”) under the Internal Revenue Code of 1986, as amended (the “Code”). We were established for the purpose of investing in debt and equity securities of established private businesses in the United States (“U.S.”). Debt investments primarily take the form of two types of loans: secured first lien loans and secured second lien loans. Equity investments primarily take the form of preferred or common equity (or warrants or options to acquire the foregoing), often in connection with buyouts and other recapitalizations. Our investment objectives are to: (i) achieve and grow current income by investing in debt securities of established businesses that we believe will provide stable earnings and cash flow to pay expenses, make principal and interest payments on our outstanding indebtedness and make distributions to stockholders that grow over time, and (ii) provide our stockholders with long-term capital appreciation in the value of our assets by investing in equity securities of established businesses, generally in combination with the aforementioned debt securities, that we believe can grow over time to permit us to sell our equity investments for capital gains. We intend that our investment portfolio over time will consist of approximately 75.0% in debt investments and 25.0% in equity investments, at cost.
Gladstone Business Investment, LLC (“Business Investment”), a wholly-owned subsidiary of ours, was established on August 11, 2006 for the sole purpose of owning our portfolio of investments in connection with our line of credit. The financial statements of Business Investment are consolidated with those of Gladstone Investment. We also have significant subsidiaries (as defined under Rule 1-02(w) of the U.S. Securities and Exchange Commission’s (“SEC”) Regulation S-X) whose financial statements are not consolidated with ours. Refer to Note 14 — Unconsolidated Significant Subsidiaries for additional information regarding our unconsolidated significant subsidiaries.
We are externally managed by Gladstone Management Corporation (the “Adviser”), an affiliate of ours and an SEC registered investment adviser, pursuant to an investment advisory agreement and management agreement. Administrative services are provided by Gladstone Administration, LLC (the “Administrator”), an affiliate of ours and the Adviser, pursuant to an administration agreement. Refer to Note 4 — Related Party Transactions for more information regarding these arrangements.
NOTE 2. SUMMARY OF SIGNIFICANT ACCOUNTING POLICIES
Basis of Presentation
These Consolidated Financial Statements and the accompanying notes are prepared in accordance with accounting principles generally accepted in the U.S. (“GAAP”) and conform to Regulation S-X under the Securities Exchange Act of 1934, as amended. Management believes it has made all necessary adjustments so that our accompanying Consolidated Financial Statements are presented fairly and that all such adjustments are of a normal recurring nature. Our accompanying Consolidated Financial Statements include our accounts and the accounts of our wholly-owned subsidiaries. All significant intercompany balances and transactions have been eliminated.
Consolidation
In accordance with Article 6 of Regulation S-X under the Securities Act of 1933, we do not consolidate portfolio company investments. Under the investment company rules and regulations pursuant to the American Institute of Certified Public Accountants (“AICPA”) Audit and Accounting Guide for Investment Companies, codified in ASC 946, we are precluded from consolidating any entity other than another investment company, except that ASC 946 provides for the consolidation of a controlled operating company that provides substantially all of its services to the investment company or its consolidated subsidiaries.
78
Use of Estimates
Preparing financial statements requires management to make estimates and assumptions that affect the amounts reported in our accompanying Consolidated Financial Statements and accompanying notes. Actual results may differ from those estimates.
Reclassifications
Certain prior year amounts have been reclassified to conform to the current year presentation.
In April 2015, the FASB issued Accounting Standards Update 2015-03, “Simplifying the Presentation of Debt Issuance Costs” (“ASU 2015-03”), which simplifies the presentation of debt issuance costs. ASU 2015-03 requires the presentation of debt issuance costs as a deduction from the carrying amount of the related debt liability instead of as a deferred financing cost asset on the balance sheet. In August 2015, the FASB issued Accounting Standards Update 2015-15, “Interest — Imputation of Interest (Subtopic 835-30): Presentation and Subsequent Measurement of Debt Issuance Costs Associated with Line-of-Credit Arrangements” (“ASU 2015-15”), which codifies an SEC staff announcement that entities are permitted to defer and present debt issuance costs related to line of credit arrangements as assets. ASU 2015-03 was effective for annual reporting periods beginning after December 15, 2015 and interim periods within those years, and we adopted ASU 2015-03 during the three months ended June 30, 2016. ASU 2015-15 was effective immediately and we opted to continue to present debt issuance costs related to line of credit arrangements as assets.
As of June 30, 2016 and March 31, 2016, we had unamortized deferred financing costs related to our mandatorily redeemable preferred stock of $3.0 million and $3.2 million, respectively. These costs have been reclassified from Deferred financing costs, net, to Mandatorily redeemable preferred stock, net. All periods presented have been retrospectively adjusted.
The following table summarizes the retrospective adjustment and the overall impact on the previously reported consolidated financial statements:
| March 31, 2016 | ||||||||
| As Previously Reported |
Retrospective Application |
|||||||
| Deferred financing costs, net |
$ | 4,332 | $ | 1,147 | ||||
| Mandatorily redeemable preferred stock, net |
121,650 | 118,465 | ||||||
Classification of Investments
In accordance with the BDC regulations in the 1940 Act, we classify portfolio investments on our accompanying Consolidated Statements of Assets and Liabilities, Consolidated Statements of Operations and Consolidated Schedules of Investments into the following categories:
| • | Non-Control/Non-Affiliate Investments — Non-Control/Non-Affiliate investments are those that are neither control nor affiliate investments and in which we typically own less than 5.0% of the issued and outstanding voting securities; |
| • | Affiliate Investments — Affiliate investments are those that are not Control investments and in which we own, with the power to vote, between and inclusive of 5.0% and 25.0% of the issued and outstanding voting securities; and |
| • | Control Investments — Control investments are those where we have the power to exercise a controlling influence over the management or policies of the portfolio company, which may include owning, with the power to vote, more than 25.0% of the issued and outstanding voting securities. |
Investment Valuation Policy
Accounting Recognition
We record our investments at fair value in accordance with the FASB ASC Topic 820, “Fair Value Measurements and Disclosures” (“ASC 820”) and the 1940 Act. Investment transactions are recorded on the trade date. Realized gains or losses are generally measured by the difference between the net proceeds from the repayment or sale and the cost basis of the investment, without regard to unrealized appreciation or depreciation previously recognized, and include investments charged off during the period, net of recoveries. Unrealized appreciation or depreciation primarily reflects the change in investment fair values, including the reversal of previously recorded unrealized appreciation or depreciation when gains or losses are realized.
79
Board Responsibility
In accordance with the 1940 Act, our Board of Directors has the ultimate responsibility for reviewing and approving, in good faith, the fair value of our investments based on our investment valuation policy (which has been approved by our Board of Directors) (the “Policy”). Such review occurs in three phases. First, prior to its quarterly meetings, the Board of Directors receives written valuation recommendations and supporting materials provided by professionals of the Adviser and Administrator with oversight and direction from the chief valuation officer (the “Valuation Team”). Second, the Valuation Committee of our Board of Directors (comprised entirely of independent directors) meets to review the valuation recommendations and supporting materials. Third, after the Valuation Committee concludes its meeting, it and the chief valuation officer present the Valuation Committee’s findings to the entire Board of Directors so that the full Board of Directors may review and approve the fair value of our investments in accordance with the Policy.
There is no single standard for determining fair value (especially for privately-held businesses), as fair value depends upon the specific facts and circumstances of each individual investment. In determining the fair value of our investments, the Valuation Team, led by the chief valuation officer, uses the Policy and each quarter the Valuation Committee and Board of Directors review the Policy to determine if changes thereto are advisable and also review whether the Valuation Team has applied the Policy consistently.
Use of Third Party Valuation Firms
The Valuation Team engages third party valuation firms to provide independent assessments of fair value of certain of our investments.
Standard & Poor’s Securities Evaluation, Inc. (“SPSE”), a valuation specialist, generally provides estimates of fair value on our debt investments. The Valuation Team generally assigns SPSE’s estimates of fair value to our debt investments where we do not have the ability to effectuate a sale of the applicable portfolio company. The Valuation Team corroborates SPSE’s estimates of fair value using one or more of the valuation techniques discussed below. The Valuation Team’s estimate of value on a specific debt investment may significantly differ from SPSE’s. When this occurs, our Valuation Committee and Board of Directors review whether the Valuation Team has followed the Policy and whether the Valuation Team’s recommended fair value is reasonable in light of the Policy and other facts and circumstances and then votes to accept or reject the Valuation Team’s recommended fair value.
We may engage other independent valuation firms to provide earnings multiple ranges, as well as other information, and evaluate such information for incorporation into the total enterprise value (“TEV”) of certain of our investments. Generally, at least once per year, we engage an independent valuation firm to value or review our valuation of our significant equity investments, which includes providing the information noted above. The Valuation Team evaluates such information for incorporation into our TEV, including review of all inputs provided by the independent valuation firm. The Valuation Team then makes a recommendation to our Valuation Committee and Board of Directors as to the fair value. Our Board of Directors reviews the recommended fair value and whether it is reasonable in light of the Policy and other relevant facts and circumstances and then votes to accept or reject the Valuation Team’s recommended fair value.
Valuation Techniques
In accordance with ASC 820, the Valuation Team uses the following techniques when valuing our investment portfolio:
| • | Total Enterprise Value — In determining the fair value using a TEV, the Valuation Team first calculates the TEV of the portfolio company by incorporating some or all of the following factors: the portfolio company’s ability to make payments and other specific portfolio company attributes; the earnings of the portfolio company (the trailing or projected twelve month revenue or earnings before interest, taxes, depreciation and amortization (“EBITDA”)); EBITDA or revenue multiples obtained from our indexing methodology whereby the original transaction EBITDA or revenue multiple at the time of our closing is indexed to a general subset of comparable disclosed transactions and EBITDA or revenue multiples from recent sales to third parties of similar securities in similar industries; a comparison to publicly traded securities in similar industries, and other pertinent factors. The Valuation Team generally reviews industry statistics and may use outside experts when gathering this information. Once the TEV is determined for a portfolio company, the Valuation Team then generally allocates the TEV to the portfolio company’s securities in order of their relative priority in the capital structure. Generally, the Valuation Team uses TEV to value our equity investments and, in the circumstances where we have the ability to effectuate a sale of a portfolio company, our debt investments. |
| TEV is primarily calculated using EBITDA or revenue multiples; however, TEV may also be calculated using a discounted cash flow (“DCF”) analysis whereby future expected cash flows of the portfolio company are discounted to determine a net present value using estimated risk-adjusted discount rates, which incorporate adjustments for nonperformance and liquidity |
80
| risks. Generally, the Valuation Team uses the DCF to calculate TEV to corroborate estimates of value for our equity investments where we do not have the ability to effectuate a sale of a portfolio company or for debt of credit impaired portfolio companies. |
| • | Yield Analysis — The Valuation Team generally determines the fair value of our debt investments (where we do not have the ability to effectuate a sale of a portfolio company) using the yield analysis, which includes a DCF calculation and the Valuation Team’s own assumptions, including, but not limited to, estimated remaining life, current market yield, current leverage, and interest rate spreads. This technique develops a modified discount rate that incorporates risk premiums including, among other things, increased probability of default, increased loss upon default and increased liquidity risk. Generally, the Valuation Team uses the yield analysis to corroborate both estimates of value provided by SPSE and market quotes. |
| • | Market Quotes — For our investments for which a limited market exists, we generally base fair value on readily available and reliable market quotations, which are corroborated by the Valuation Team (generally by using the yield analysis explained above). In addition, the Valuation Team assesses trading activity for similar investments and evaluates variances in quotations and other market insights to determine if any available quoted prices are reliable. Typically, the Valuation Team uses the lower indicative bid price (“IBP”) in the bid-to-ask price range obtained from the respective originating syndication agent’s trading desk on or near the valuation date. The Valuation Team may take further steps to consider additional information to validate that price in accordance with the Policy. For restricted securities of portfolio companies that are publicly traded, we generally base fair value on the closing market price of our shares as of the reporting date less a discount for the restriction, which includes consideration of the nature and term to expiration of the restriction. |
| • | Investments in Funds — For equity investments in other funds, where we cannot effectuate a sale, the Valuation Team generally determines the fair value of our uninvested capital at par value and of our invested capital at the Net Asset Value (“NAV”) provided by the fund. The Valuation Team may also determine fair value of our investments in other investment funds based on the capital accounts of the underlying entity. |
In addition to the valuation techniques listed above, the Valuation Team may also consider other factors when determining the fair value of our investments, including but not limited to: the nature and realizable value of the collateral, including external parties’ guaranties; any relevant offers or letters of intent to acquire the portfolio company; timing of expected loan repayments; and the markets in which the portfolio company operates. If applicable, new and follow-on debt and equity investments made during the current reporting quarter are generally valued at our original cost basis.
Fair value measurements of our investments may involve subjective judgments and estimates and, due to the uncertainty inherent in valuing these securities, the Adviser’s determinations of fair value may fluctuate from period to period and may differ materially from the values that could be obtained if a ready market for these securities existed. Our NAV could be materially affected if the Adviser’s determinations regarding the fair value of our investments are materially different from the values that we ultimately realize upon our disposal of such securities. Additionally, changes in the market environment and other events that may occur over the life of the investment may cause the gains or losses ultimately realized on these investments to be different than the valuations currently assigned. Further, such investments are generally subject to legal and other restrictions on resale or otherwise are less liquid than publicly traded securities. If we were required to liquidate a portfolio investment in a forced or liquidation sale, we could realize significantly less than the value at which it is recorded.
Refer to Note 3 — Investments for additional information regarding fair value measurements and our application of ASC 820.
Realized Gain or Loss and Unrealized Appreciation or Depreciation of Portfolio Investments
Gains or losses on the sale of investments are calculated by using the specific identification method. A realized gain or loss is recognized at the trade date, typically when an investment is disposed of, and is computed as the difference between the cost basis of the investment on the disposition date and the net proceeds received from such disposition. Unrealized appreciation or depreciation displays the difference between the fair value of the investment and the cost basis of such investment. We determine the fair value of each individual investment each reporting period and record changes in fair value as unrealized appreciation or depreciation in our Consolidated Statement of Operations.
81
Revenue Recognition
Interest Income Recognition
Interest income, adjusted for amortization of premiums, amendment fees and acquisition costs and the accretion of discounts, is recorded on the accrual basis to the extent that such amounts are expected to be collected. Generally, when a loan becomes 90 days or more past due, or if our qualitative assessment indicates that the debtor is unable to service its debt or other obligations, we will place the loan on non-accrual status and cease recognizing interest income on that loan until the borrower has demonstrated the ability and intent to pay contractual amounts due. However, we remain contractually entitled to this interest. Interest payments received on non-accrual loans may be recognized as income or applied to the cost basis, depending upon management’s judgment. Generally, non-accrual loans are restored to accrual status when past-due principal and interest are paid, and, in management’s judgment, are likely to remain current, or due to a restructuring, the interest income is deemed to be collectible. As of March 31, 2017, certain of our loans to Alloy Die Cast Co. (“ADC”) and Tread Corporation (“Tread”) were on non-accrual status, with an aggregate debt cost basis of $15.6 million, or 4.1% of the cost basis of all debt investments in our portfolio, and an aggregate fair value of $11.9 million, or 3.3% of the fair value of all debt investments in our portfolio. As of March 31, 2016, our loan to Tread was on non-accrual status, with an aggregate debt cost basis of $1.4 million, or 0.4% of the cost basis of all debt investments in our portfolio, and an aggregate fair value of $1.4 million, or 0.4% of the fair value of all debt investments in our portfolio.
Paid-in-kind (“PIK”) interest, computed at the contractual rate specified in the loan agreement, is added to the principal balance of the loan and recorded as interest income. As of March 31, 2017 and 2016, we did not have any loans with a PIK interest component. During the years ended March 31, 2017 and 2016, we did not record any PIK income, nor did we collect any PIK interest in cash. During the year ended March 31, 2015, we recorded PIK income of $0.1 million and collected PIK interest in cash of $0.2 million.
Other Income Recognition
We record success fees as
income when earned, which often occurs upon receipt of cash. Success fees are generally contractually due upon a change of control in a portfolio company, typically from an exit or sale. We recorded $2.4 million, $1.6 million, and
$1.4 million of success fee income during the years ended March 31, 2017, 2016, and 2015, respectively
We accrue dividend income on preferred and common equity securities to the extent that such amounts are expected to be collected and if we have the option to collect such amounts in cash or other consideration. We recorded $3.3 million, $2.9 million, and $3.5 million of dividend income during the years ended March 31, 2017, 2016, and 2015, respectively.
During the year ended March 31, 2017, we re-characterized $0.5 million of dividend income from our investment in Behrens Manufacturing, LLC (“Behrens”), which was originally recorded during our fiscal year ended March 31, 2016, as a return of capital.
Both dividend and success fee income are recorded in other income in our accompanying Consolidated Statements of Operations.
Cash and Cash Equivalents
We consider all short-term, highly liquid investments that are both readily convertible to cash and have a maturity of three months or less at the time of purchase to be cash equivalents. Cash is carried at cost, which approximates fair value. We place our cash with financial institutions, and at times, cash held in checking accounts may exceed the Federal Deposit Insurance Corporation insured limit. We seek to mitigate this concentration of credit risk by depositing funds with major financial institutions.
Restricted Cash and Cash Equivalents
Restricted cash is generally cash held in escrow received as part of an investment exit. Restricted cash is carried at cost, which approximates fair value.
Deferred Financing and Offering Costs
Deferred financing and offering costs consist of costs incurred to obtain financing, including lender fees and legal fees. Certain costs associated with our revolving line of credit are deferred and amortized using the straight-line method, which approximates the effective interest method, over the term of the revolving line of credit. Costs associated with the issuance of our mandatorily redeemable prefered stock are presented as discounts to the liquidation value of the mandatorily redeemable preferred stock and are amortized using the straight-line method, which approximates the effective interest method, over the terms of the respective financings. See Note 5 — Borrowings and Note 6 — Mandatorily Redeemable Preferred Stock for further discussion.
82
Related Party Fees
We have entered into an investment advisory and management agreement (the “Advisory Agreement”) with the Adviser, which is owned and controlled by our chairman and chief executive officer. In accordance with the Advisory Agreement, we pay the Adviser fees as compensation for its services, consisting of a base management fee and an incentive fee. Additionally, we pay the Adviser a loan servicing fee as compensation for its services as servicer under the terms of the Fifth Amended and Restated Credit Agreement dated April 30, 2013, as amended (the “Credit Facility”).
We have entered into an administration agreement (the “Administration Agreement”) with the Administrator, which is owned and controlled by our chairman and chief executive officer, whereby we pay separately for administrative services. These fees are accrued when the services are performed and generally paid one month in arrears.
Refer to Note 4 — Related Party Transactions for additional information regarding these related party fees and agreements.
Federal Income Taxes
We intend to continue to maintain our qualification as a RIC under subchapter M of the Code for federal income tax purposes. As a RIC, we generally are not subject to federal income tax on the portion of our taxable income and gains distributed to our stockholders. To maintain our qualification as a RIC, we must maintain our status as a BDC and meet certain source-of-income and asset diversification requirements. In addition, in order to qualify to be taxed as a RIC, we must distribute to stockholders at least 90% of our taxable ordinary income plus the excess of our net short-term capital gains over net long-term capital losses (“Investment Company Taxable Income”). Our policy generally is to make distributions to our stockholders in an amount up to 100% of our Investment Company Taxable Income. We intend to continue to make sufficient distributions to qualify as a RIC and to generally limit taxable income. Refer to Note 10 — Federal and State Income Taxes for additional information regarding our RIC requirements.
FASB ASC 740, Income Taxes (“ASC 740”) requires the evaluation of tax positions taken or expected to be taken in the course of preparing our tax returns to determine whether the tax positions are “more-likely-than-not” of being sustained by the applicable tax authorities. Tax positions not deemed to satisfy the “more-likely-than-not” threshold would be recorded as a tax benefit or expense in the current fiscal year. We have evaluated the implications of ASC 740 for all open tax years and in all major tax jurisdictions, and determined that there is no material impact on our accompanying Consolidated Financial Statements. Our federal tax returns for fiscal years 2016, 2015, and 2014 remain subject to examination by the Internal Revenue Service (“IRS”).
Distributions
Distributions to stockholders are recorded on the ex-dividend date. We are required to distribute at least 90% of our Investment Company Taxable Income for each taxable year as a distribution to our stockholders in order to maintain our ability to be taxed as a RIC under Subchapter M of the Code. It is our policy to pay out as a distribution up to 100% of those amounts. The amount to be paid is determined by our Board of Directors each quarter and is based on an estimate of annual Investment Company Taxable Income. Based on that estimate, a distribution is declared each quarter and is paid out monthly over the course of the respective quarter. At fiscal year-end, we may elect to treat a portion of the first distributions paid after year-end as having been paid in the prior year in accordance with Section 855(a) of the Code. We may retain some or all of our net long-term capital gains, if any, but we generally intend to distribute such gains to stockholders in cash or to designate them as deemed distributions. If we decide to retain long-term capital gains and treat them as deemed distributions, the net long-term capital gain will be subject to federal income tax.
Refer to Note 9 — Distributions to Common Stockholders for further information.
Our common stockholders who hold their shares through our transfer agent, Computershare, Inc. (“Computershare”), have the option to participate in a dividend reinvestment plan offered by Computershare. This is an “opt in” dividend reinvestment plan, meaning that common stockholders may elect to have their cash distributions automatically reinvested in additional shares of our common stock. Common stockholders who do not so elect will receive their distributions in cash. Common stockholders who receive distributions in the form of stock will be subject to the same federal, state and local tax consequences as stockholders who elect to receive their distributions in cash. The common stockholder will have an adjusted basis in the additional common shares purchased through the plan equal to the amount of the reinvested distribution. The additional shares will have a new holding period commencing on the day following the date on which the shares are credited to the common stockholder’s account. Our plan agent purchases shares in the open market in connection with the obligations under the plan. The Computershare dividend reinvestment plan is not open to holders of our preferred stock.
83
Recent Accounting Pronouncements
In November 2016, the FASB issued Accounting Standards Update 2016-18, “Restricted Cash (a consensus of the Emerging Issues Task Force)” (“ASU 2016-18”), which requires that the statement of cash flows explain the change during the period in the total of cash, cash equivalents, and amounts generally described as restricted cash or restricted cash equivalents. We are currently assessing the impact of ASU 2016-18 and do not anticipate a material impact on our financial position, results of operations or cash flows. ASU 2016-18 is effective for annual reporting periods beginning after December 15, 2017, including interim periods within those fiscal years, with early adoption permitted.
In August 2016, the FASB issued Accounting Standards Update 2016-15, “Classification of Certain Cash Receipts and Cash Payments (a consensus of the Emerging Issues Task Force)” (“ASU 2016-15”), which is intended to reduce diversity in practice in how certain transactions are classified in the statement of cash flows. We are currently assessing the impact of ASU 2016-15 and do not anticipate a material impact on our financial position, results of operations or cash flows. ASU 2016-15 is effective for annual reporting periods beginning after December 15, 2017, including interim periods within those fiscal years, with early adoption permitted.
In March 2016, the FASB issued Accounting Standards Update 2016-06, “Contingent Put and Call Options in Debt Instruments” (“ASU 2016-06”), which clarifies the requirements for assessing whether contingent call (put) options that can accelerate the payment of principal on debt instruments are clearly and closely related. We have assessed the impact of ASU 2016-06 and do not anticipate a material impact on our financial position, results of operations or cash flows. ASU 2016-06 is effective for annual reporting periods beginning after December 15, 2016, including interim periods within those fiscal years, with early adoption permitted.
In January 2016, the FASB issued Accounting Standards Update 2016-01, “Financial Instruments–Overall: Recognition and Measurement of Financial Assets and Financial Liabilities” (“ASU 2016-01”), which changes how entities measure certain equity investments and how entities present changes in the fair value of financial liabilities measured under the fair value option that are attributable to instrument-specific credit risk. We are currently assessing the impact of ASU 2016-01 and do not anticipate a material impact on our financial position, results of operations or cash flows. ASU 2016-01 is effective for annual reporting periods beginning after December 15, 2017, including interim periods within those fiscal years, with early adoption permitted for certain aspects of ASU 2016-01 relating to the recognition of changes in fair value of financial liabilities when the fair value option is elected.
In May 2015, the FASB issued Accounting Standards Update 2015-07, “Disclosures for Investments in Certain Entities That Calculate Net Asset Value Per Share (or its Equivalent)” (“ASU 2015-07”), which eliminates the requirement to categorize investments in the fair value hierarchy if their fair value is measured at net asset value per share (or its equivalent) using the practical expedient in the FASB’s fair value measurement guidance. The adoption of ASU 2015-07 did not have a material impact on our financial position, results of operations or cash flows. ASU 2015-07 is required to be adopted retrospectively and is effective for annual reporting periods beginning after December 15, 2015 and interim periods within those years, and we adopted ASU 2015-07 effective April 1, 2016.
In February 2015, the FASB issued Accounting Standards Update 2015-02, “Amendments to the Consolidation Analysis” (“ASU 2015-02”), which amends or supersedes the scope and consolidation guidance under existing GAAP. The adoption of ASU 2015-02 did not have a material impact on our financial position, results of operations or cash flows. ASU 2015-02 is effective for annual reporting periods beginning after December 15, 2015 and interim periods within those years, and we adopted ASU 2015-02 effective April 1, 2016. In October 2016, the FASB issued Accounting Standards Update 2016-17, “Interests Held through Related Parties That Are under Common Control” (“ASU 2016-17”), which amends the consolidation guidance in ASU 2015-02 regarding the treatment of indirect interests held through related parties that are under common control. We have assessed the impact of ASU 2016-17 and do not anticipate a material impact on our financial position, results of operations or cash flows. ASU 2016-17 is effective for annual reporting periods beginning after December 15, 2016 and interim periods within those years, with early adoption permitted.
In August 2014, the FASB issued Accounting Standards Update 2014–15, “Presentation of Financial Statements — Going Concern (Subtopic 205 – 40): Disclosure of Uncertainties About an Entity’s Ability to Continue as a Going Concern” (“ASU 2014-15”). ASU 2014-15 requires management to evaluate whether there are conditions or events that raise substantial doubt about the entity’s ability to continue as a going concern, and to provide certain disclosures when it is probable that the entity will be unable to meet its obligations as they become due within one year after the date that the financial statements are issued. The guidance is primarily around certain disclosures to the financial statements. The adoption of ASU 2014-15 did not have a material impact on our financial position, results of operations or cash flows. ASU 2014-15 is effective for annual periods ending after December 15, 2016 and annual and interim periods thereafter, and we adopted ASU 2014-15 effective March 31, 2017.
84
In May 2014, the FASB issued Accounting Standards Update 2014-09, “Revenue from Contracts with Customers” (“ASU 2014-09”), which was amended in March 2016 by FASB Accounting Standards Update 2016-08, “Principal versus Agent Considerations” (“ASU 2016-08”), in April 2016 by FASB Accounting Standards Update 2016-10, “Identifying Performance Obligations and Licensing” (“ASU 2016-10”), in May 2016 by FASB Accounting Standards Update 2016-12, “Narrow-Scope Improvements and Practical Expedients” (“ASU 2016-12”), and in December 2016 by FASB Accounting Standards Update 2016-20, “Technical Corrections and Improvements to Topic 606” (“ASU 2016-20”). ASU 2014-09, as amended, supersedes or replaces nearly all GAAP revenue recognition guidance. The new guidance establishes a new control-based revenue recognition model, changes the basis for deciding when revenue is recognized over time or at a point in time and will expand disclosures about revenue. In July 2015, the FASB issued Accounting Standards Update 2015-14, “Deferral of the Effective Date,” which deferred the effective date of ASU 2014-09. ASU 2014-09, as amended by ASU 2015-14, ASU 2016-08, ASU 2016-10, ASU 2016-12, and ASU 2016-20, is now effective for annual reporting periods beginning after December 15, 2017 and interim periods within those years, with early adoption permitted for annual reporting periods beginning after December 15, 2016 and interim periods within those years. We continue to assess the impact of ASU 2014-09, as amended, and expect to identify similar performance obligations as compared to existing guidance. As a result, we do not anticipate a material change in the timing of revenue recognition or a material impact on our financial position, results of operations, or cash flows from adopting this standard.
NOTE 3. INVESTMENTS
Fair Value
In accordance with ASC 820, our investments’ fair value is determined to be the price that would be received for an investment in a current sale, which assumes an orderly transaction between willing market participants on the measurement date. This fair value definition focuses on exit price in the principal, or most advantageous, market and prioritizes, within a measurement of fair value, the use of market-based inputs over entity-specific inputs. ASC 820 also establishes the following three-level hierarchy for fair value measurements based upon the transparency of inputs to the valuation of a financial instrument as of the measurement date.
| • | Level 1 — inputs to the valuation methodology are quoted prices (unadjusted) for identical financial instruments in active markets; |
| • | Level 2 — inputs to the valuation methodology include quoted prices for similar financial instruments in active or inactive markets, and inputs that are observable for the financial instrument, either directly or indirectly, for substantially the full term of the financial instrument. Level 2 inputs are in those markets for which there are few transactions, the prices are not current, little public information exists or instances where prices vary substantially over time or among brokered market makers; and |
| • | Level 3 — inputs to the valuation methodology are unobservable and significant to the fair value measurement. Unobservable inputs are those inputs that reflect assumptions that market participants would use when pricing the financial instrument and can include the Valuation Team’s assumptions based upon the best available information. |
When a determination is made to classify our investments within Level 3 of the valuation hierarchy, such determination is based upon the significance of the unobservable factors to the overall fair value measurement. However, Level 3 financial instruments typically include, in addition to the unobservable, or Level 3, inputs, observable inputs (or, components that are actively quoted and can be validated to external sources). The level in the fair value hierarchy within which the fair value measurement falls is determined based on the lowest level input that is significant to the fair value measurement.
As of March 31, 2017, all of our investments were valued using Level 3 inputs within the ASC 820 fair value hierarchy, except for our investment in AquaVenture Holdings Limited (“AquaVenture,” f/k/a Quench Holdings Corp.), which was valued using Level 2 inputs. As of March 31, 2016, all of our investments were valued using Level 3 inputs within the ASC 820 fair value hierarchy.
We transfer investments in and out of Level 1, 2 and 3 securities as of the beginning balance sheet date, based on changes in the use of observable and unobservable inputs utilized to perform the valuation for the period. During the year ended March 31, 2017, we transferred our investment in AquaVenture from Level 3 to Level 2 as a result of its initial public offering in October 2016. During the year ended March 31, 2016, there were no transfers in or out of Level 1, 2 and 3.
85
As of March 31, 2017 and 2016, our investments, by security type, at fair value were categorized as follows within the ASC 820 fair value hierarchy:
| Fair Value Measurements | ||||||||||||||||
| Fair Value | Quoted Prices in Active Markets for Identical Assets (Level 1) |
Significant Other Observable Inputs (Level 2) |
Significant Unobservable Inputs (Level 3) |
|||||||||||||
| As of March 31, 2017: |
||||||||||||||||
| Secured first lien debt |
$ | 268,150 | $ | — | $ | — | $ | 268,150 | ||||||||
| Secured second lien debt |
95,040 | — | — | 95,040 | ||||||||||||
| Preferred equity |
113,515 | — | — | 113,515 | ||||||||||||
| Common equity/equivalents |
24,874 | — | 3,433 | (A) | 21,441 | |||||||||||
|
|
|
|
|
|
|
|
|
|||||||||
| Total Investments at March 31, 2017 |
$ | 501,579 | $ | — | $ | 3,433 | $ | 498,146 | ||||||||
|
|
|
|
|
|
|
|
|
|||||||||
| (A) | Fair value was determined based on the closing market price of our shares at the reporting date less a discount for lack of marketability as our investment is subject to a 180-day lock-up period, which expired in April 2017. |
| Fair Value Measurements | ||||||||||||||||
| Fair Value | Quoted Prices in Active Markets for Identical Assets (Level 1) |
Significant Other Observable Inputs (Level 2) |
Significant Unobservable Inputs (Level 3) |
|||||||||||||
| As of March 31, 2016: |
||||||||||||||||
| Secured first lien debt |
$ | 280,037 | $ | — | $ | — | $ | 280,037 | ||||||||
| Secured second lien debt |
64,484 | — | — | 64,484 | ||||||||||||
| Preferred equity |
113,550 | — | — | 113,550 | ||||||||||||
| Common equity/equivalents |
29,585 | — | — | 29,585 | ||||||||||||
|
|
|
|
|
|
|
|
|
|||||||||
| Total Investments at March 31, 2016 |
$ | 487,656 | $ | — | $ | — | $ | 487,656 | ||||||||
|
|
|
|
|
|
|
|
|
|||||||||
86
The following table presents our investments valued using Level 3 inputs carried at fair value as of March 31, 2017 and 2016, by caption on our accompanying Consolidated Statements of Assets and Liabilities, and by security type:
| Total Recurring Level 3 Fair Value Measurements Reported in Consolidated Statements of Assets and Liabilities March 31, |
||||||||
| 2017 | 2016 | |||||||
|
Non-Control/Non-Affiliate Investments |
||||||||
| Secured first lien debt |
$ | 108,613 | $ | 92,343 | ||||
| Secured second lien debt |
45,822 | 35,366 | ||||||
| Preferred equity |
44,142 | 31,696 | ||||||
| Common equity/equivalents |
21,441 | (A) | 21,528 | |||||
|
|
|
|
|
|||||
| Total Non-Control/Non-Affiliate Investments |
220,018 | 180,933 | ||||||
| Affiliate Investments |
||||||||
| Secured first lien debt |
154,737 | 182,694 | ||||||
| Secured second lien debt |
44,218 | 24,118 | ||||||
| Preferred equity |
63,131 | 81,854 | ||||||
| Common equity/equivalents |
— | 8,057 | ||||||
|
|
|
|
|
|||||
| Total Affiliate Investments |
262,086 | 296,723 | ||||||
| Control Investments |
||||||||
| Secured first lien debt |
4,800 | 5,000 | ||||||
| Secured second lien debt |
5,000 | 5,000 | ||||||
| Preferred equity |
6,242 | — | ||||||
| Common equity/equivalents |
— | — | ||||||
|
|
|
|
|
|||||
| Total Control Investments |
16,042 | 10,000 | ||||||
|
|
|
|
|
|||||
| Total investments at fair value using Level 3 inputs |
$ | 498,146 | $ | 487,656 | ||||
|
|
|
|
|
|||||
| (A) | Excludes our investment in AquaVenture with a fair value of $3.4 million, which was valued using Level 2 inputs. |
87
In accordance with the FASB’s ASU No. 2011-04, “Fair Value Measurement (Topic 820): Amendments to Achieve Common Fair Value Measurement and Disclosure Requirements in U.S. GAAP and International Financial Reporting Standards (“IFRS”) (“ASU 2011-04”), the following table provides quantitative information about our investments valued using Level 3 fair value measurements as of March 31, 2017 and 2016. The table below is not intended to be all-inclusive, but rather provides information on the significant Level 3 inputs as they relate to our fair value measurements. The weighted average calculations in the table below are based on the principal balances for all debt-related calculations and on the cost basis for all equity-related calculations for the particular input.
| Quantitative Information about Level 3 Fair Value Measurements | ||||||||||||||||||
| Fair Value as of March 31, 2017 |
Fair Value as of March 31, 2016 |
Valuation Technique/ Methodology |
Unobservable |
Range / Weighted Average as of March 31, 2017 |
Range / Weighted March 31, 2016 | |||||||||||||
| Secured first lien debt |
$ | 232,590 | (A) | $ | 238,707 | TEV | EBITDA multiple | 4.3x – 7.9x / 6.2x | 4.4x – 8.2x / 6.3x | |||||||||
| EBITDA | $897 - $10,887 / $4,093 |
$970 - $8,713 / $3,374 | ||||||||||||||||
| Discount Rate | — | 20.0% - 20.0% / 20.0% | ||||||||||||||||
| 35,560 | 41,330 | (B) | Yield Analysis | Discount Rate | 13.1% - 30.3% / 19.7% | 14.2% - 17.7% / 16.4% | ||||||||||||
| Secured second lien debt |
81,747 | (C) | 46,418 | (C) | TEV | EBITDA multiple | 5.3x – 7.4x / 6.4x | 5.5x – 6.2x / 5.9x | ||||||||||
| EBITDA | $2,357 - $5,824 / $4,588 | $2,718 - $4,851 / $3,790 | ||||||||||||||||
| 13,293 | 18,066 | Yield Analysis | Discount Rate | 9.2% - 9.2% / 9.2% |
10.1% - 20.0% / 15.1% | |||||||||||||
| Preferred equity(D) |
113,515 | 113,550 | TEV | EBITDA multiple | 4.8x – 7.9x / 6.3x | 4.4x – 8.2x / 6.4x | ||||||||||||
| EBITDA | $897 - $97,366 / $4,415 | $0 - $76,487 / $3,565 | ||||||||||||||||
| Discount Rate | — | 20.0% - 20.0% / 20.0% | ||||||||||||||||
| Revenue multiple | 0.5x – 0.5x / 0.5x | 0.2x – 0.5x / 0.4x | ||||||||||||||||
| Revenue | $21,662 - $21,662 / $21,662 | $29,300 - $56,937 / $42,761 | ||||||||||||||||
| Common equity/ |
21,441 | 29,585 | TEV | EBITDA multiple | 4.3x – 9.8x / 6.0x | 4.4x – 11.0x / 8.7x | ||||||||||||
| EBITDA | $897 - $13,378 / $3,687 | $0 - $76,487 / $820 | ||||||||||||||||
| Discount Rate | — | 20.0% - 20.0% / 20.0% | ||||||||||||||||
| Revenue multiple | 0.5x – 0.5x / 0.5x | 0.2x – 0.5x / 0.2x | ||||||||||||||||
| Revenue | $21,662 - $21,662 / $21,662 | $29,300 - $56,937 / $56,937 | ||||||||||||||||
|
|
|
|
|
|||||||||||||||
| Total |
$ | 498,146 | $ | 487,656 | ||||||||||||||
|
|
|
|
|
|||||||||||||||
| (A) | Fair value as of March 31, 2017 includes two new proprietary debt investments for a combined $24.0 million, which were valued at cost. |
| (B) | Fair value as of March 31, 2016 includes one proprietary debt investment for $5.3 million which was valued at the expected payoff amount. |
| (C) | Fair value as of March 31, 2017 includes one proprietary debt investment for $15.2 million, which was valued at the expected payoff amount. Fair value as of March 31, 2016 includes one proprietary debt investment for $14.5 million, which was valued at the expected payoff amount. |
| (D) | Fair value as of March 31, 2017 includes one new proprietary equity investment for $5.9 million, which was valued at cost, and one proprietary equity investment for $3.9 million, which was valued at the expected payoff amount. Fair value as of March 31, 2016 includes one proprietary equity investment for $22.3 million, which was valued at the expected exit amount. |
| (E) | Fair value as of March 31, 2017 includes one proprietary equity investment for $28, which was valued at the expected payoff amount. Fair value as of March 31, 2016 includes two proprietary equity investments for a combined $8.1 million, which were valued at the expected exit amounts. |
| (F) | Fair value as of March 31, 2017 excludes our investment in AquaVenture with a fair value of $3.4 million, which was valued using Level 2 inputs. |
Fair value measurements can be sensitive to changes in one or more of the valuation inputs. Changes in discount rates, EBITDA or EBITDA multiples (or revenue or revenue multiples), each in isolation, may change the fair value of certain of our investments. Generally, an increase/(decrease) in discount rates or a (decrease)/increase in EBITDA or EBITDA multiples (or revenue or revenue multiples) may result in a (decrease)/increase in the fair value of certain of our investments.
88
Changes in Level 3 Fair Value Measurements of Investments
The following tables provide the changes in fair value of our portfolio, broken out by security type, during the years ended March 31, 2017 and 2016 for all investments for which the Adviser determines fair value using unobservable (Level 3) inputs.
Fair Value Measurements Using Significant Unobservable Inputs (Level 3)
| Secured First Lien Debt |
Secured Second Lien Debt |
Preferred Equity |
Common Equity/ Equivalents |
Total | ||||||||||||||||
| Year ended March 31, 2017: |
||||||||||||||||||||
| Fair value as of March 31, 2016 |
$ | 280,037 | $ | 64,484 | $ | 113,550 | $ | 29,585 | $ | 487,656 | ||||||||||
| Total gain (loss): |
||||||||||||||||||||
| Net realized gain (loss)(A) |
(7,725 | ) | — | 3,436 | 18,903 | 14,614 | ||||||||||||||
| Net unrealized appreciation (depreciation)(B) |
(9,258 | ) | 10,456 | 19,400 | 3,769 | 24,367 | ||||||||||||||
| Reversal of previously recorded depreciation (appreciation) upon realization(B) |
8,796 | — | (18,525 | ) | (6,834 | ) | (16,563 | ) | ||||||||||||
| New investments, repayments and settlements(C): |
||||||||||||||||||||
| Issuances / originations |
37,482 | 19,600 | 13,659 | 501 | 71,242 | |||||||||||||||
| Settlements / repayments |
(26,182 | ) | (14,500 | ) | — | — | (40,682 | ) | ||||||||||||
| Sales |
— | — | (18,005 | ) | (20,124 | ) | (38,129 | ) | ||||||||||||
| Transfers(D) |
(15,000 | ) | 15,000 | — | (4,359 | ) | (4,359 | ) | ||||||||||||
|
|
|
|
|
|
|
|
|
|
|
|||||||||||
| Fair value as of March 31, 2017 |
$ | 268,150 | $ | 95,040 | $ | 113,515 | $ | 21,441 | $ | 498,146 | ||||||||||
|
|
|
|
|
|
|
|
|
|
|
|||||||||||
| Secured First Lien Debt |
Secured Second Lien Debt |
Preferred Equity |
Common Equity/ Equivalents |
Total | ||||||||||||||||
| Year ended March 31, 2016: |
||||||||||||||||||||
| Fair value as of March 31, 2015 |
$ | 267,545 | $ | 65,974 | $ | 111,090 | $ | 21,444 | $ | 466,053 | ||||||||||
| Total gain (loss): |
||||||||||||||||||||
| Net realized gain (loss)(A) |
(11,316 | ) | (10,520 | ) | 17,039 | 349 | (4,448 | ) | ||||||||||||
| Net unrealized appreciation (depreciation)(B) |
5,123 | (5,932 | ) | 6,012 | 8,099 | 13,302 | ||||||||||||||
| Reversal of previously recorded depreciation (appreciation) upon realization(B) |
9,572 | 3,462 | (17,492 | ) | (107 | ) | (4,565 | ) | ||||||||||||
| New investments, repayments and settlements(C): |
||||||||||||||||||||
| Issuances / originations |
45,502 | 13,000 | 17,089 | 249 | 75,840 | |||||||||||||||
| Settlements / repayments |
(36,389 | ) | (1,500 | ) | — | — | (37,889 | ) | ||||||||||||
| Sales |
— | — | (20,188 | ) | (449 | ) | (20,637 | ) | ||||||||||||
| Transfers |
— | — | — | — | — | |||||||||||||||
|
|
|
|
|
|
|
|
|
|
|
|||||||||||
| Fair value as of March 31, 2016 |
$ | 280,037 | $ | 64,484 | $ | 113,550 | $ | 29,585 | $ | 487,656 | ||||||||||
|
|
|
|
|
|
|
|
|
|
|
|||||||||||
| (A) | Included in net realized gain (loss) on investments on our accompanying Consolidated Statements of Operations for the years ended March 31, 2017 and 2016. |
| (B) | Included in net unrealized appreciation (depreciation) of investments on our accompanying Consolidated Statements of Operations for the years ended March 31, 2017 and 2016. |
| (C) | Includes increases in the cost basis of investments resulting from new portfolio investments, the amortization of discounts, PIK and other non-cash disbursements to portfolio companies, as well as decreases in the cost basis of investments resulting from principal repayments or sales, the amortization of premiums and acquisition costs, and other cost-basis adjustments. |
| (D) | Transfers represent $15.0 million of secured first lien debt of Cambridge Sound Management, Inc. (“Cambridge”), which was converted into secured second lien debt, and $4.4 million of common equity of AquaVenture, which was transferred from Level 3 to Level 2 as a result of its initial public offering. |
Investment Activity
During the year ended March 31, 2017, the following significant transactions occurred:
| • | In April 2016, we sold our investment in Acme Cryogenics, Inc. (“Acme”), which resulted in dividend income of $2.8 million and a net realized gain of $18.8 million. In connection with the sale, we received net cash proceeds of $44.6 million, including the repayment of our debt investment of $14.5 million at par and net receivables of $0.6 million, which were recorded within Other assets, net. |
| • | In May 2016, we invested $25.5 million in The Mountain Corporation (“The Mountain”) through a combination of secured second lien debt and preferred equity. The Mountain, headquartered in Keene, New Hampshire, is a designer and manufacturer of premium quality, bold artwear apparel serving a diverse global customer base. |
89
| • | In October 2016, we restructured our investment in D.P.M.S., Inc (“Danco”). As a result of the restructure, we exchanged existing debt with a cost basis of $16.5 million for a new $8.8 million secured first lien term loan, relinquished our preferred equity with a cost basis of $2.5 million, and relinquished a portion of our common equity with a total cost basis of $3. The transaction resulted in a realized loss of $10.2 million. |
| • | In December 2016, we sold our investment in Behrens Manufacturing, LLC (“Behrens”), which resulted in success fee income of $0.9 million and a net realized gain of $5.8 million. In connection with the sale, we received net cash proceeds of $19.2 million, including the repayment of our debt investment of $10.0 million at par. |
| • | In February 2017, our $5.0 million investment in Auto Safety House, LLC was repaid at par plus $0.5 million of success fee income. |
| • | In February 2017, we invested $28.9 million in JR Hobbs Co. – Atlanta, LLC (“JR Hobbs”) through a combination of secured first lien debt and preferred equity. JR Hobbs, headquartered in Lawrenceville, Georgia, is an HVAC installation subcontractor focused on the multifamily and light commercial construction market in the Southeast U.S. |
Investment Concentrations
As of March 31, 2017, our investment portfolio consisted of investments in 35 portfolio companies located in 17 states across 18 different industries with an aggregate fair value of $501.6 million. Our investments in JR Hobbs, Counsel Press, Inc., Cambridge, Nth Degree, Inc., and Drew Foam Companies, Inc. represent our five largest portfolio investments at fair value, and collectively comprised $137.5 million, or 27.4%, of our total investment portfolio at fair value.
The following table summarizes our investments by security type as of March 31, 2017 and 2016:
| March 31, 2017 | March 31, 2016 | |||||||||||||||||||||||||||||||
| Cost | Fair Value | Cost | Fair Value | |||||||||||||||||||||||||||||
| Secured first lien debt |
$ | 284,823 | 54.3 | % | $ | 268,150 | 53.5 | % | $ | 296,247 | 57.2 | % | $ | 280,037 | 57.4 | % | ||||||||||||||||
| Secured second lien debt |
93,078 | 17.7 | 95,040 | 18.9 | 72,978 | 14.1 | 64,484 | 13.2 | ||||||||||||||||||||||||
|
|
|
|
|
|
|
|
|
|
|
|
|
|
|
|
|
|||||||||||||||||
| Total debt |
377,901 | 72.0 | 363,190 | 72.4 | 369,225 | 71.3 | 344,521 | 70.6 | ||||||||||||||||||||||||
| Preferred equity |
140,791 | 26.8 | 113,515 | 22.6 | 141,702 | 27.3 | 113,550 | 23.3 | ||||||||||||||||||||||||
| Common equity/equivalents |
6,477 | 1.2 | 24,874 | 5.0 | 7,198 | 1.4 | 29,585 | 6.1 | ||||||||||||||||||||||||
|
|
|
|
|
|
|
|
|
|
|
|
|
|
|
|
|
|||||||||||||||||
| Total equity/equivalents |
147,268 | 28.0 | 138,389 | 27.6 | 148,900 | 28.7 | 143,135 | 29.4 | ||||||||||||||||||||||||
|
|
|
|
|
|
|
|
|
|
|
|
|
|
|
|
|
|||||||||||||||||
| Total investments |
$ | 525,169 | 100.0 | % | $ | 501,579 | 100.0 | % | $ | 518,125 | 100.0 | % | $ | 487,656 | 100.0 | % | ||||||||||||||||
|
|
|
|
|
|
|
|
|
|
|
|
|
|
|
|
|
|||||||||||||||||
90
Investments at fair value consisted of the following industry classifications as of March 31, 2017 and 2016:
| March 31, 2017 | March 31, 2016 | |||||||||||||||
| Fair Value | Percentage of Total Investments |
Fair Value | Percentage of Total Investments |
|||||||||||||
| Home and Office Furnishings, Housewares, and Durable Consumer Products |
$ | 93,062 | 18.6 | % | $ | 86,811 | 17.8 | % | ||||||||
| Diversified/Conglomerate Service |
85,248 | 17.0 | 49,901 | 10.2 | ||||||||||||
| Chemicals, Plastics, and Rubber |
65,156 | 13.0 | 90,602 | 18.6 | ||||||||||||
| Diversified/Conglomerate Manufacturing |
40,303 | 8.0 | 64,986 | 13.3 | ||||||||||||
| Leisure, Amusement, Motion Pictures, Entertainment |
32,453 | 6.5 | 43,330 | 8.9 | ||||||||||||
| Automobile |
20,792 | 4.1 | 24,402 | 5.0 | ||||||||||||
| Textiles and Leather |
20,369 | 4.1 | 11,995 | 2.5 | ||||||||||||
| Farming and Agriculture |
19,096 | 3.8 | 21,005 | 4.3 | ||||||||||||
| Personal and Non-Durable Consumer Products (Manufacturing Only) |
19,011 | 3.8 | 315 | 0.1 | ||||||||||||
| Containers, Packaging, and Glass |
18,266 | 3.6 | 20,108 | 4.1 | ||||||||||||
| Machinery (Non-agriculture, Non-construction, Non-electronic) |
17,283 | 3.4 | 20,011 | 4.1 | ||||||||||||
| Aerospace and Defense |
16,042 | 3.2 | 10,000 | 2.1 | ||||||||||||
| Cargo Transport |
15,891 | 3.2 | 14,484 | 3.0 | ||||||||||||
| Beverage, Food, and Tobacco |
14,802 | 3.0 | 9,050 | 1.8 | ||||||||||||
| Telecommunications |
14,000 | 2.8 | 14,000 | 2.9 | ||||||||||||
| Other < 2.0% |
9,805 | 1.9 | 6,656 | 1.3 | ||||||||||||
|
|
|
|
|
|
|
|
|
|||||||||
| Total investments |
$ | 501,579 | 100.0 | % | $ | 487,656 | 100.0 | % | ||||||||
|
|
|
|
|
|
|
|
|
|||||||||
Investments at fair value were included in the following geographic regions of the U.S. as of March 31, 2017 and 2016:
| March 31, 2017 | March 31, 2016 | |||||||||||||||
| Fair Value | Percentage of Total Investments |
Fair Value | Percentage of Total Investments |
|||||||||||||
| South |
$ | 175,136 | 34.9 | % | $ | 129,934 | 26.6 | % | ||||||||
| Northeast |
159,614 | 31.8 | 183,265 | 37.6 | ||||||||||||
| West |
123,475 | 24.6 | 124,713 | 25.6 | ||||||||||||
| Midwest |
43,354 | 8.7 | 49,744 | 10.2 | ||||||||||||
|
|
|
|
|
|
|
|
|
|||||||||
| Total investments |
$ | 501,579 | 100.0 | % | $ | 487,656 | 100.0 | % | ||||||||
|
|
|
|
|
|
|
|
|
|||||||||
The geographic region indicates the location of the headquarters for our portfolio companies. A portfolio company may have additional business locations in other geographic regions.
Investment Principal Repayments
The following table summarizes the contractual principal repayments and maturity of our investment portfolio for the next five fiscal years and thereafter, assuming no voluntary prepayments, as of March 31, 2017:
| Amount(A) | ||||||
| For the fiscal years ending March 31: | 2018 | $ | 60,640 | |||
| 2019 | 76,941 | |||||
| 2020 | 100,408 | |||||
| 2021 | 75,515 | |||||
| 2022 | 64,397 | |||||
| Thereafter | — | |||||
|
|
|
|||||
| Total contractual repayments | $ | 377,901 | ||||
| Investments in equity securities | 147,268 | |||||
|
|
|
|||||
| Total cost basis of investments held as of March 31, 2017: |
$ | 525,169 | ||||
|
|
|
|||||
| (A) | Subsequent to March 31, 2017, one debt investment with a principal balance of $13.6 million maturing during the fiscal year ending March 31, 2018 was repaid at par and debt investments in two portfolio companies with principal balances of $4.0 million and $18.4 million, which previously had maturity dates during the fiscal year ending March 31, 2018, were extended to mature during the fiscal year ending March 31, 2019 and March 31, 2021, respectively. |
91
Receivables from Portfolio Companies
Receivables from portfolio companies represent non-recurring costs that we incurred on behalf of portfolio companies. Such receivables, net of any allowance for uncollectible receivables, are included in Other assets, net on our accompanying Consolidated Statements of Assets and Liabilities. We generally maintain an allowance for uncollectible receivables from portfolio companies when the receivable balance becomes 90 days or more past due or if it is determined, based upon management’s judgment, that the portfolio company is unable to pay its obligations. We write-off accounts receivable when collection efforts have been exhausted and the receivables are deemed uncollectible. As of March 31, 2017 and 2016, we had gross receivables from portfolio companies of $1.2 million and $1.0 million, respectively. The allowance for uncollectible receivables was $0.3 million and $0.4 million as of March 31, 2017 and 2016, respectively.
NOTE 4. RELATED PARTY TRANSACTIONS
Transactions with the Adviser
We pay the Adviser certain fees as compensation for its services, such fees consisting of a base management fee and an incentive fee, as provided for in the Advisory Agreement, and a loan servicing fee for the Adviser’s role as servicer pursuant to the Credit Facility, each as described below. On July 12, 2016, our Board of Directors, including a majority of the directors who are not parties to the Advisory Agreement or interested persons of such party, approved the annual renewal of the Advisory Agreement through August 31, 2017.
Two of our executive officers, David Gladstone (our chairman and chief executive officer) and Terry Brubaker (our vice chairman and chief operating officer) serve as directors and executive officers of the Adviser, which is 100% indirectly owned and controlled by Mr. Gladstone. David Dullum (our president) is also an executive managing director of the Adviser.
The following table summarizes the base management fees, loan servicing fees, incentive fees, and associated non-contractual, unconditional, and irrevocable credits reflected in our accompanying Consolidated Statements of Operations:
| Year Ended March 31, | ||||||||||||
| 2017 | 2016 | 2015 | ||||||||||
| Average total assets subject to base management fee(A) |
$ | 496,250 | $ | 496,250 | $ | 378,450 | ||||||
| Multiplied by annual base management fee of 2.0% |
2.0 | % | 2.0 | % | 2.0 | % | ||||||
|
|
|
|
|
|
|
|||||||
| Base management fee(B) |
9,925 | 9,925 | 7,569 | |||||||||
| Credits to fees from Adviser — other(B) |
(3,506 | ) | (3,126 | ) | (2,848 | ) | ||||||
|
|
|
|
|
|
|
|||||||
| Net base management fee |
$ | 6,419 | $ | 6,799 | $ | 4,721 | ||||||
|
|
|
|
|
|
|
|||||||
| Loan servicing fee(B) |
6,606 | 6,697 | 4,994 | |||||||||
| Credits to base management fee — loan servicing fee(B) |
(6,606 | ) | (6,697 | ) | (4,994 | ) | ||||||
|
|
|
|
|
|
|
|||||||
| Net loan servicing fee |
$ | — | $ | — | $ | — | ||||||
|
|
|
|
|
|
|
|||||||
| Incentive fee(B) |
4,750 | 5,179 | 4,975 | |||||||||
| Credits to fees from Adviser — other(B) |
— | — | — | |||||||||
|
|
|
|
|
|
|
|||||||
| Net incentive fee |
$ | 4,750 | $ | 5,179 | $ | 4,975 | ||||||
|
|
|
|
|
|
|
|||||||
| (A) | Average total assets subject to the base management fee is defined as total assets, including investments made with proceeds of borrowings, less any uninvested cash or cash equivalents resulting from borrowings, valued at the end of the applicable quarters within the respective periods and adjusted appropriately for any share issuances or repurchases during the periods. |
| (B) | Reflected as a line item on our accompanying Consolidated Statement of Operations. |
Base Management Fee
The base management fee is payable quarterly to the Adviser pursuant to our Advisory Agreement and is assessed at an annual rate of 2.0%, computed on the basis of the value of our average gross assets at the end of the two most recently completed quarters (inclusive of the current quarter), which are total assets, including investments made with proceeds of borrowings, less any uninvested cash or cash equivalents resulting from borrowings, and adjusted appropriately for any share issuances or repurchases during the period.
Additionally, pursuant to the requirements of the 1940 Act, the Adviser makes available significant managerial assistance to our portfolio companies. The Adviser may also provide other services to our portfolio companies under certain agreements and may receive fees for services other than managerial assistance. Such services may include, but are not limited to: (i) assistance obtaining, sourcing or structuring credit facilities, long term loans or additional equity from unaffiliated third parties; (ii) negotiating important contractual financial relationships; (iii) consulting services regarding restructuring of the portfolio company and financial modeling as it relates to raising additional debt and equity capital from unaffiliated third parties; and (iv) primary role in interviewing, vetting and negotiating employment contracts with candidates in connection with adding and retaining key portfolio company management team members.
92
The Adviser voluntarily, unconditionally, and irrevocably credits 100% of these fees against the base management fee that we would otherwise be required to pay to the Adviser; however, pursuant to the terms of the Advisory Agreement, a small percentage of certain of such fees, totaling $0.3 million, $0.2 million, and $0.1 million for the years ended March 31, 2017, 2016, and 2015, respectively, was retained by the Adviser in the form of reimbursement, at cost, for tasks completed by personnel of the Adviser and primarily for the valuation of portfolio companies.
Loan Servicing Fee
The Adviser also services the loans held by our wholly-owned subsidiary, Business Investment (the borrower under the Credit Facility), in return for which the Adviser receives a 2.0% annual fee based on the monthly aggregate outstanding balance of loans pledged under the Credit Facility. Since Business Investment is a consolidated subsidiary of ours, coupled with the fact that the total base management fee paid to the Adviser pursuant to the Advisory Agreement cannot exceed 2.0% of total assets (as reduced by cash and cash equivalents pledged to creditors) during any given calendar year, we treat payment of the loan servicing fee pursuant to the Credit Facility as a pre-payment of the base management fee under the Advisory Agreement. Accordingly, these loan servicing fees are 100% voluntarily, unconditionally, and irrevocably credited back to us by the Adviser.
Incentive Fee
The incentive fee payable to the Adviser under our Advisory Agreement consists of two parts: an income-based incentive fee and a capital gains-based incentive fee.
The income-based incentive fee rewards the Adviser if our quarterly net investment income (before giving effect to any incentive fee) exceeds 1.75% of our net assets, adjusted appropriately for any share issuances or repurchases during the period (the “Hurdle Rate”). The income-based incentive fee with respect to our pre-incentive fee net investment income is payable quarterly to the Adviser and is computed as follows:
| • | No incentive fee in any calendar quarter in which our pre-incentive fee net investment income does not exceed the Hurdle Rate (7.0% annualized); |
| • | 100.0% of our pre-incentive fee net investment income with respect to that portion of such pre-incentive fee net investment income, if any, that exceeds the Hurdle Rate but is less than 2.1875% of our net assets, adjusted appropriately for any share issuances or repurchases during the period, in any calendar quarter (8.75% annualized); and |
| • | 20.0% of the amount of our pre-incentive fee net investment income, if any, that exceeds 2.1875% of our net assets, adjusted appropriately for any share issuances or repurchases during the period, in any calendar quarter (8.75% annualized). |
The second part of the incentive fee is a capital gains-based incentive fee that is determined and payable in arrears as of the end of each fiscal year (or upon termination of the Advisory Agreement, as of the termination date), and equals 20.0% of our realized capital gains, less any realized capital losses and unrealized depreciation, calculated as of the end of the preceding calendar year. The capital gains-based incentive fee payable to the Adviser is calculated based on (i) cumulative aggregate realized capital gains since our inception, less (ii) cumulative aggregate realized capital losses since our inception, less (iii) the entire portfolio’s aggregate unrealized capital depreciation, if any, as of the date of the calculation. If this number is positive at the applicable calculation date, then the capital gains-based incentive fee for such year equals 20.0% of such amount, less the aggregate amount of any capital gains-based incentive fees paid in respect of our portfolio in all prior years. For calculation purposes, cumulative aggregate realized capital gains, if any, equals the sum of the excess between the net sales price of each investment, when sold, and the original cost of such investment since our inception. Cumulative aggregate realized capital losses equals the sum of the deficit between the net sales price of each investment, when sold, and the original cost of such investment since our inception. The entire portfolio’s aggregate unrealized capital depreciation, if any, equals the sum of deficit between the fair value of each investment security as of the applicable calculation date and the original cost of such investment security. We have not incurred capital gains-based incentive fees from inception through March 31, 2017, as aggregate net unrealized capital depreciation has exceeded cumulative realized capital gains net of cumulative realized capital losses.
Additionally, in accordance with GAAP, a capital gains-based incentive fee accrual is calculated using the aggregate cumulative realized capital gains and losses and aggregate unrealized capital depreciation included in the calculation of the capital gains-based incentive fee plus the aggregate unrealized capital appreciation. If such amount is positive at the end of a reporting period, then GAAP
93
requires us to record a capital gains-based incentive fee equal to 20.0% of such amount, less the aggregate amount of actual capital gains-based incentive fees paid in all prior years. If such amount is negative, then there is no accrual for such period. GAAP requires that the capital gains-based incentive fee accrual consider the aggregate unrealized capital appreciation in the calculation, as a capital gains-based incentive fee would be payable if such unrealized capital appreciation were realized. There can be no assurance that any such unrealized capital appreciation will be realized in the future. There has been no GAAP accrual recorded for a capital gains-based incentive fee since our inception through March 31, 2017.
Transactions with the Administrator
We pay the Administrator pursuant to the Administration Agreement for our allocable portion of the Administrator’s expenses incurred while performing services to us, which are primarily rent and salaries and benefits expenses of the Administrator’s employees, including, but not limited to, our chief financial officer and treasurer, chief valuation officer, chief compliance officer and general counsel and secretary (who also serves as the Administrator’s president) and their respective staffs. Prior to July 1, 2014, our allocable portion of the expenses was generally derived by multiplying that portion of the Administrator’s expenses allocable to all funds managed by the Adviser and serviced by the Administrator by the percentage of our total assets at the beginning of each quarter in comparison to the total assets at the beginning of each quarter of all funds managed by the Adviser and serviced by the Administrator.
Effective July 1, 2014, our allocable portion of the Administrator’s expenses are generally derived by multiplying the Administrator’s total expenses by the approximate percentage of time during the current quarter the Administrator’s employees performed services for us in relation to their time spent performing services for all companies serviced by the Administrator. These administrative fees are accrued at the end of the quarter when the services are performed and recorded on our accompanying Consolidated Statements of Operations and generally paid the following quarter. On July 12, 2016, our Board of Directors approved the annual renewal of the Administration Agreement through August 31, 2017.
Other Transactions
Gladstone Securities, LLC (“Gladstone Securities”), a privately-held broker-dealer registered with the Financial Industry Regulatory Authority and insured by the Securities Investor Protection Corporation, which is 100% indirectly owned and controlled by Mr. Gladstone, our chairman and chief executive officer, has provided other services, such as investment banking and due diligence services, to certain of our portfolio companies, for which Gladstone Securities receives a fee. Any such fees paid by portfolio companies to Gladstone Securities do not impact the fees we pay to the Adviser or the non-contractual, unconditional, and irrevocable credits against the base management fee. The fees received by Gladstone Securities from portfolio companies during the years ended March 31, 2017, 2016, and 2015 totaled $0.5 million, $0.6 million, and $1.1 million, respectively.
Related Party Fees Due
Amounts due to related parties on our accompanying Consolidated Statements of Assets and Liabilities were as follows:
| As of March 31, | ||||||||
| 2017 | 2016 | |||||||
| Base management and loan servicing fee due to Adviser, net of credits |
$ | 346 | $ | 647 | ||||
| Incentive fee due to Adviser |
1,324 | 1,224 | ||||||
| Other due to Adviser |
1 | 41 | ||||||
|
|
|
|
|
|||||
| Total fees due to Adviser |
$ | 1,671 | $ | 1,912 | ||||
| Fee due to Administrator |
$ | 296 | $ | 311 | ||||
|
|
|
|
|
|||||
| Total related party fees due |
$ | 1,967 | $ | 2,223 | ||||
|
|
|
|
|
|||||
Net co-investment expenses receivable from (payable to) Gladstone Capital Corporation, one of our affiliated funds, for reimbursement purposes, and receivables from (payables to) other affiliates collectively totaled $27 and ($19) as of March 31, 2017 and 2016, respectively. These amounts are generally settled in the quarter subsequent to being incurred and have been included in Other Assets, net or Other liabilities, as appropriate, on the accompanying Consolidated Statements of Assets and Liabilities as of March 31, 2017 and 2016, respectively.
94
NOTE 5. BORROWINGS
Revolving Line of Credit
On November 16, 2016, we, through our wholly-owned subsidiary, Business Investment, entered into Amendment No. 2 to the Fifth Amended and Restated Credit Agreement, originally entered into on April 30, 2013 and as previously amended on June 26, 2014, with KeyBank National Association (“KeyBank”), as administrative agent, lead arranger, managing agent and lender, the Adviser, as servicer, and certain other lenders party thereto. The revolving period was extended to November 15, 2019, and if not renewed or extended by such date, all principal and interest will be due and payable on or before November 15, 2021 (two years after the revolving period end date). The amended Credit Facility provides two one-year extension options that may be exercised on or before the first and second anniversary of the November 16, 2016 amendment date, subject to approval by all lenders. Additionally, the Credit Facility commitment amount was changed from $185.0 million to $165.0 million and, subject to certain terms and conditions, can be expanded to a total facility amount of $250.0 million through additional commitments of existing or new lenders. Advances under the Credit Facility generally bear interest at 30-day London Interbank Offered Rate (“LIBOR”) plus 3.15% per annum until November 15, 2019, with the margin then increasing to 3.40% for the period from November 15, 2019 to November 15, 2020, and increasing further to 3.65% thereafter. The Credit Facility has an unused commitment fee of 0.50% per annum on the portion of the total unused commitment amount that is less than or equal to 45.0% of the total commitment amount and 0.80% per annum on the total unused commitment amount that is greater than 45.0%. We incurred fees of approximately $1.4 million in connection with this amendment.
On January 20, 2017, we entered into Amendment No. 3 to the Credit Facility, which clarified a definition in the Company’s performance guaranty under the Credit Facility.
The following tables summarize noteworthy information related to the Credit Facility:
| As of March 31, | ||||||||
| 2017 | 2016 | |||||||
| Commitment amount |
$ | 165,000 | $ | 185,000 | ||||
| Borrowings outstanding at cost |
69,700 | 95,000 | ||||||
| Availability(A) |
95,300 | 90,000 | ||||||
| For the Years Ended March 31 | ||||||||||||
| 2017 | 2016 | 2015 | ||||||||||
| Weighted average borrowings outstanding |
$ | 67,364 | $ | 94,608 | $ | 79,158 | ||||||
| Effective interest rate(B) |
4.72 | % | 4.04 | % | 3.98 | % | ||||||
| Commitment (unused) fees incurred |
$ | 598 | $ | 465 | $ | 347 | ||||||
| (A) | Availability is subject to various constraints, characteristics and applicable advance rates based on collateral quality under the Credit Facility, which equated to an adjusted availability of $93.4 million and $47.1 million as of March 31, 2017 and 2016, respectively. |
| (B) | Excludes the impact of deferred financing costs and includes weighted average unused commitment fees. |
Interest is payable monthly during the term of the Credit Facility. Available borrowings are subject to various constraints and applicable advance rates, which are generally based on the size, characteristics, and quality of the collateral pledged by Business Investment. The Credit Facility also requires that any interest and principal payments on pledged loans be remitted directly by the borrower into a lockbox account with KeyBank. KeyBank is also the trustee of the account and generally remits the collected funds to us once a month.
Among other things, the Credit Facility contains covenants that require Business Investment to maintain its status as a separate legal entity, prohibit certain significant corporate transactions (such as mergers, consolidations, liquidations or dissolutions) and restrict certain material changes to our credit and collection policy without the lenders’ consent. The Credit Facility also generally seeks to restrict distributions to shareholders to the sum of (i) our net investment income, (ii) net capital gains, and (iii) amounts deemed by the Company to be considered as having been paid during the prior fiscal year in accordance with Section 855(a) of the Code. Loans eligible to be pledged as collateral are subject to certain limitations, including, among other things, restrictions on geographic concentrations, industry concentrations, loan size, payment frequency and status, average life, portfolio company leverage, and lien property. The Credit Facility also requires Business Investment to comply with other financial and operational covenants, which obligate Business Investment to, among other things, maintain certain financial ratios, including asset and interest coverage and a minimum number of obligors required in the borrowing base. Additionally, the Credit Facility contains a performance guaranty that requires the Company to maintain (i) a minimum net worth (defined in the Credit Facility to include our mandatory redeemable term preferred stock) of the greater of $210.0 million or $210.0 million plus 50% of all equity and subordinated debt raised minus 50% of any equity or subordinated debt redeemed or retired after November 16, 2016, which equates to $210.0 million as of March 31, 2017, (ii) asset coverage with respect to senior securities representing indebtedness of at least 200%, in accordance with Sections 18 and 61
95
of the 1940 Act and (iii) our status as a BDC under the 1940 Act and as a RIC under the Code. As of March 31, 2017, and as defined in the performance guaranty of the Credit Facility, we had a net worth of $434.3 million, an asset coverage ratio on our senior securities representing indebtedness of 661.3%, calculated in compliance with the requirements of Sections 18 and 61 of the 1940 Act, and an active status as a BDC and RIC. As of March 31, 2017, we were in compliance with all covenants under the Credit Facility.
In July 2013, pursuant to the terms of the then effective revolving line of credit, we entered into an interest rate cap agreement with KeyBank effective October 2013 for a notional amount of $45.0 million. The interest rate cap agreement expired in April 2016. Prior to its expiration in April 2016, the agreement effectively limited the interest rate on a portion of our borrowings under the then effective revolving line of credit. We incurred a premium fee of $75 in conjunction with this agreement, which was recorded in Net realized loss on other on our accompanying Consolidated Statements of Operations during the year ended March 31, 2017. As of March 31, 2016, the fair value of our interest rate cap agreement was $0.
Secured Borrowing
In August 2012, we entered into a participation agreement with a third-party related to $5.0 million of our secured second lien term debt investment in Ginsey Home Solutions, Inc. (“Ginsey”). In May 2014, we amended the agreement with the third-party to include an additional $0.1 million. ASC Topic 860, “Transfers and Servicing” requires us to treat the participation as a financing-type transaction. Specifically, the third-party has a senior claim to our remaining investment in the event of default by Ginsey which, in part, resulted in the loan participation bearing a rate of interest lower than the contractual rate established at origination. Therefore, our accompanying Consolidated Statements of Assets and Liabilities reflects the entire secured second lien term debt investment in Ginsey and a corresponding $5.1 million secured borrowing liability. The secured borrowing has a stated fixed interest rate of 7.0% and a maturity date of January 3, 2021.
Fair Value
We elected to apply the fair value option of ASC 825, “Financial Instruments,” to the Credit Facility, which was consistent with our application of ASC 820 to our investments. Generally, the fair value of the Credit Facility is determined using a yield analysis, which includes a DCF calculation and also takes into account the Valuation Team’s own assumptions, including, but not limited to, the estimated remaining life, counterparty credit risk, current market yield and interest rate spreads of similar securities as of the measurement date. At March 31, 2017 and 2016, the discount rate used to determine the fair value of the Credit Facility was 30-day LIBOR, plus 3.15% per annum, and 30-day LIBOR, plus 3.25% per annum, respectively, plus an unused fee of 0.6% and 0.5%, respectively. Generally, an increase or decrease in the discount rate used in the DCF calculation may result in a corresponding decrease or increase, respectively, in the fair value of the Credit Facility. At each of March 31, 2017 and 2016, the Credit Facility was valued using Level 3 inputs and any changes in its fair value are recorded in Net unrealized depreciation (appreciation) of other on our accompanying Consolidated Statements of Operations.
The following tables present the Credit Facility, carried at fair value using Level 3 inputs of the hierarchy established by ASC 820 on our accompanying Consolidated Statements of Assets and Liabilities as of March 31, 2017 and 2016, and a roll-forward of the changes in fair value during the years ended March 31, 2017 and 2016:
| Level 3 — Borrowings | ||||||||
| Recurring Fair Value Measurements Reported in Consolidated Statements of Assets and Liabilities Using Significant Unobservable Inputs (Level 3) As of March 31, |
||||||||
| 2017 | 2016 | |||||||
| Credit Facility |
$ | 69,700 | $ | 95,000 | ||||
|
|
|
|
|
|||||
96
| Fair Value Measurements of Borrowings Using Significant Unobservable Inputs (Level 3) |
||||
| Reported in Consolidated Statements of Assets and Liabilities |
||||
| Credit Facility |
||||
| Year ended March 31, 2017: |
||||
| Fair value at March 31, 2016 |
$ | 95,000 | ||
| Borrowings |
83,400 | |||
| Repayments |
(108,700 | ) | ||
|
|
|
|||
| Fair value at March 31, 2017 |
$ | 69,700 | ||
|
|
|
|||
| Year ended March 31, 2016: |
||||
| Fair value at March 31, 2015 |
$ | 118,800 | ||
| Borrowings |
105,000 | |||
| Repayments |
(128,800 | ) | ||
|
|
|
|||
| Fair value at March 31, 2016 |
$ | 95,000 | ||
|
|
|
|||
The fair value of the collateral under the Credit Facility was $448.0 million and $461.4 million as of March 31, 2017 and 2016, respectively.
NOTE 6. MANDATORILY REDEEMABLE PREFERRED STOCK
In September 2016, we completed a public offering of 2,300,000 shares of 6.25% Series D Cumulative Term Preferred Stock (our “Series D Term Preferred Stock” or “Series D”) at a public offering price of $25.00 per share. Gross proceeds totaled $57.5 million and net proceeds, after deducting underwriting discounts and offering costs borne by us, were $55.4 million. Total underwriting discounts and offering costs related to this offering were $2.1 million, which have been recorded as discounts to the liquidation value on our accompanying Consolidated Statements of Assets and Liabilities and are being amortized over the period ending September 30, 2023, the mandatory redemption date.
The shares of Series D Term Preferred Stock are traded under the ticker symbol GAINM on the NASDAQ Global Select Market (“NASDAQ”). Our Series D Term Preferred Stock is not convertible into our common stock or any other security and provides for a fixed dividend equal to 6.25% per year, payable monthly. We are required to redeem all shares of our outstanding Series D Term Preferred Stock on September 30, 2023, for cash at a redemption price equal to $25.00 per share, plus an amount equal to accumulated but unpaid dividends, if any, to, but excluding, the date of redemption. In addition, two other potential mandatory redemption triggers are as follows: (1) upon the occurrence of certain events that would constitute a change in control of us, we would be required to redeem all of our outstanding Series D Term Preferred Stock, and (2) if we fail to maintain an asset coverage ratio of at least 200% and are unable to correct such failure within a specific amount of time, we are required to redeem a portion of our outstanding Series D Term Preferred Stock or otherwise cure the ratio redemption trigger (and we may also redeem additional securities to cause the asset coverage ratio to be 240%). We may also voluntarily redeem all or a portion of our Series D Term Preferred Stock at our sole option at the redemption price at any time on or after September 30, 2018.
In May 2015, we completed a public offering of 1,610,000 shares of 6.50% Series C Cumulative Term Preferred Stock (our “Series C Term Preferred Stock” or “Series C”) at a public offering price of $25.00 per share. Gross proceeds totaled $40.3 million and net proceeds, after deducting underwriting discounts and offering costs borne by us, were $38.6 million. Total underwriting discounts and offering costs related to this offering were $1.6 million, which have been recorded as discounts to the liquidation value on our accompanying Consolidated Statements of Assets and Liabilities and are being amortized over the period ending May 31, 2022, the mandatory redemption date.
The shares of Series C Term Preferred Stock are traded under the ticker symbol GAINN on the NASDAQ. Our Series C Term Preferred Stock is not convertible into our common stock or any other security. Our Series C Term Preferred Stock provides for a fixed dividend equal to 6.50% per year, payable monthly. We are required to redeem all shares of our outstanding Series C Term Preferred Stock on May 31, 2022, for cash at a redemption price equal to $25.00 per share, plus an amount equal to accumulated but unpaid dividends, if any, to, but excluding, the date of redemption. In addition, two other potential mandatory redemption triggers are as follows: (1) upon the occurrence of certain events that would constitute a change in control of us, we would be required to redeem all of our outstanding Series C Term Preferred Stock, and (2) if we fail to maintain an asset coverage ratio of at least 200% and are unable to correct such failure within a specific amount of time, we are required to redeem a portion of our outstanding Series C Term Preferred Stock or otherwise cure the ratio redemption trigger (and we may also redeem additional securities to cause the asset coverage ratio to be 215%). We may also voluntarily redeem all or a portion of our Series C Term Preferred Stock at our sole option at the redemption price at any time on or after May 31, 2018.
97
In November 2014, we completed a public offering of 1,656,000 shares of 6.75% Series B Cumulative Term Preferred Stock (our “Series B Term Preferred Stock” or “Series B”) at a public offering price of $25.00 per share. Gross proceeds totaled $41.4 million and net proceeds, after deducting underwriting discounts and offering costs borne by us, were $39.7 million. Total underwriting discounts and offering costs related to this offering were $1.7 million, which have been recorded as discounts to the liquidation value on our accompanying Consolidated Statements of Assets and Liabilities and are being amortized over the period ending December 31, 2021, the mandatory redemption date.
The shares of Series B Term Preferred Stock are traded under the ticker symbol GAINO on the NASDAQ. Our Series B Term Preferred Stock is not convertible into our common stock or any other security. Our Series B Term Preferred Stock provides for a fixed dividend equal to 6.75% per year, payable monthly. We are required to redeem all shares of our outstanding Series B Term Preferred Stock on December 31, 2021, for cash at a redemption price equal to $25.00 per share, plus an amount equal to accumulated but unpaid dividends, if any, to, but excluding, the date of redemption. In addition, two other potential mandatory redemption triggers are as follows: (1) upon the occurrence of certain events that would constitute a change in control of us, we would be required to redeem all of our outstanding Series B Term Preferred Stock, (2) if we fail to maintain an asset coverage ratio of at least 200%, we are required to redeem a portion of our outstanding Series B Term Preferred Stock or otherwise cure the ratio redemption trigger (and we may also redeem additional securities to cause the asset coverage ratio to be 215%). We may also voluntarily redeem all or a portion of our Series B Term Preferred Stock at our sole option at the redemption price at any time on or after December 31, 2017.
In March 2012, we completed an offering of 1,600,000 shares of 7.125% Series A Cumulative Term Preferred Stock (our “Series A Term Preferred Stock” or “Series A”) at a public offering price of $25.00 per share. Gross proceeds totaled $40.0 million, and net proceeds, after deducting underwriting discounts and offering costs borne by us, were $38.0 million, a portion of which was used to repay borrowings under the Credit Facility, with the remaining proceeds being held to make additional investments and for general corporate purposes. Total underwriting discounts and offering costs related to this offering were $2.0 million, which have been recorded as discounts to the liquidation value on our accompanying Consolidated Statements of Assets and Liabilities and which, prior to the redemption in September 2016, were amortized over the period ending February 28, 2017, the mandatory redemption date.
In September 2016, we used a portion of the proceeds from the issuance of our Series D Term Preferred Stock to voluntarily redeem all 1.6 million outstanding shares of our Series A Term Preferred Stock, which had a liquidation preference of $25.00 per share. In connection with this voluntary redemption, we incurred a loss on extinguishment of debt of $0.2 million, which has been recorded in Realized loss on other in our accompanying Consolidated Statements of Operations and which was primarily comprised of unamortized deferred issuance costs at the time of redemption.
Prior to its redemption in September 2016, our Series A Term Preferred Stock provided for a fixed dividend equal to 7.125% per year, payable monthly. We were required to redeem all of the outstanding Series A Term Preferred Stock on February 28, 2017, for cash at a redemption price equal to $25.00 per share plus an amount equal to accumulated but unpaid dividends, if any, to the date of redemption. Our Series A Term Preferred Stock was not convertible into our common stock or any other security.
The following tables summarize our Series A Term Preferred Stock, Series B Term Preferred Stock, Series C Term Preferred Stock, and Series D Term Preferred Stock outstanding as of March 31, 2017 and 2016:
As of March 31, 2017:
|
Class of |
Ticker Symbol |
Date Issued |
Mandatory Redemption Date (A) |
Interest Rate |
Shares Outstanding |
Liquidation Preference per Share |
Total Liquidation Preference |
|||||||||||||||
| Series B | GAINO | November 13, 2014 |
December 31, 2021 |
6.75 | % | 1,656,000 | $ | 25.00 | $ | 41,400 | ||||||||||||
| Series C | GAINN | May 12, 2015 |
May 31, 2022 | 6.50 | % | 1,610,000 | 25.00 | 40,250 | ||||||||||||||
| Series D | GAINM | September 26, 2016 |
September 30, 2023 |
6.25 | % | 2,300,000 | 25.00 | 57,500 | ||||||||||||||
|
|
|
|
|
|
|
|||||||||||||||||
| Term preferred stock, gross(B) |
5,566,000 | $ | 25.00 | $ | 139,150 | |||||||||||||||||
| Less: Discounts |
(4,315 | ) | ||||||||||||||||||||
|
|
|
|||||||||||||||||||||
| Term preferred stock, net(C) |
$ | 134,835 | ||||||||||||||||||||
|
|
|
|||||||||||||||||||||
98
As of March 31, 2016:
|
Class of |
Ticker Symbol |
Date Issued | Mandatory Redemption Date(A) |
Interest Rate |
Shares Outstanding |
Liquidation Preference per Share |
Total Liquidation Preference |
|||||||||||||
| Series A | GAINP | March 6, 2012 |
February 28, 2017 |
7.125% | 1,600,000 | $25.00 | $40,000 | |||||||||||||
| Series B | GAINO | November 13, 2014 |
December 31, 2021 |
6.750% | 1,656,000 | 25.00 | 41,400 | |||||||||||||
| Series C | GAINN | May 12, 2015 |
May 31, 2022 |
6.500% | 1,610,000 | 25.00 | 40,250 | |||||||||||||
|
|
|
|
|
|
|
|||||||||||||||
| Term preferred stock, gross(B) |
4,866,000 | $ | 25.00 | $ | 121,650 | |||||||||||||||
| Less: Discounts |
(3,185 | ) | ||||||||||||||||||
|
|
|
|||||||||||||||||||
| Term preferred stock, net(C) |
$ | 118,465 | ||||||||||||||||||
|
|
|
|||||||||||||||||||
| (A) | The optional redemption dates for each of our series of mandatorily redeemable preferred stock are February 28, 2016 for our Series A Term Preferred Stock (and we redeemed all outstanding shares of our Series A Term Preferred Stock on September 30, 2016), December 31, 2017 for our Series B Term Preferred Stock, May 31, 2018 for our Series C Term Preferred Stock, and September 30, 2018 for our Series D Term Preferred Stock. |
| (B) | As of March 31, 2017 and 2016, the asset coverage on our senior securities that are stock calculated pursuant to Sections 18 and 61 of the 1940 Act was 235.6% and 221.4%, respectively. |
| (C) | Reflected as a line item on our accompanying Consolidated Statements of Assets and Liabilities pursuant to the adoption of ASU 2015-03. Refer to Note 2 — Summary of Significant Accounting Policies — Reclassifications for additional information regarding the adoption of ASU 2015-03. |
The following tables summarize dividends declared by our Board of Directors and paid by us on each of our series of mandatorily redeemable preferred stock during the years ended March 31, 2017, 2016, and 2015:
For the Year Ended March 31, 2017:
| Declaration Date |
Record Date |
Payment Date |
Dividend per Series A Term Preferred Share |
Dividend per Series B Term Preferred Share |
Dividend per Series C Term Preferred Share |
Dividend per Series D Term Preferred Share |
||||||||||||||
| April 12, 2016 |
April 22, 2016 | May 2, 2016 | $ | 0.1484375 | $ | 0.140625 | $ | 0.135417 | $ | — | ||||||||||
| April 12, 2016 |
May 19, 2016 | May 31, 2016 | 0.1484375 | 0.140625 | 0.135417 | — | ||||||||||||||
| April 12, 2016 |
June 17, 2016 | June 30, 2016 | 0.1484375 | 0.140625 | 0.135417 | — | ||||||||||||||
| July 12, 2016 |
July 22, 2016 | August 2, 2016 | 0.1484375 | 0.140625 | 0.135417 | — | ||||||||||||||
| July 12, 2016 |
August 22, 2016 | August 31, 2016 | 0.1484375 | 0.140625 | 0.135417 | — | ||||||||||||||
| July 12, 2016 |
September 21, 2016 | September 30, 2016 | 0.1484375 | 0.140625 | 0.135417 | — | ||||||||||||||
| October 11, 2016 |
October 21, 2016 | October 31, 2016 | — | 0.140625 | 0.135417 | 0.15190972 | (A) | |||||||||||||
| October 11, 2016 |
November 17, 2016 | November 30, 2016 | — | 0.140625 | 0.135417 | 0.13020833 | ||||||||||||||
| October 11, 2016 |
December 20, 2016 | December 30, 2016 | — | 0.140625 | 0.135417 | 0.13020833 | ||||||||||||||
| January 10, 2017 |
January 20, 2017 | January 31, 2017 | — | 0.140625 | 0.135417 | 0.13020833 | ||||||||||||||
| January 10, 2017 |
February 16, 2017 | February 28, 2017 | — | 0.140625 | 0.135417 | 0.13020833 | ||||||||||||||
| January 10, 2017 |
March 22, 2017 | March 31, 2017 | — | 0.140625 | 0.135417 | 0.13020833 | ||||||||||||||
|
|
|
|
|
|
|
|
|
|||||||||||||
| Total | $ | 0.8906250 | $ | 1.687500 | $ | 1.625004 | $ | 0.80295137 | ||||||||||||
|
|
|
|
|
|
|
|
|
|||||||||||||
| (A) | Represents a combined dividend for a prorated month of September 2016, based upon the issuance date of our Series D Term Preferred Stock, combined with a full month of October 2016. |
99
For the Year Ended March 31, 2016:
| Declaration Date |
Record Date |
Payment Date |
Dividend per Series A Term Preferred Share |
Dividend per Series B Term Preferred Share |
Dividend per Series C Term Preferred Share |
|||||||||||
| April 14, 2015 | April 24, 2015 | May 5, 2015 | $ | 0.1484375 | $ | 0.140625 | $ | — | ||||||||
| April 14, 2015 | May 19, 2015 | May 29, 2015 | 0.1484375 | 0.140625 | — | |||||||||||
| April 14, 2015 | June 19, 2015 | June 30, 2015 | 0.1484375 | 0.140625 | — | |||||||||||
| May 14, 2015(B) | June 19, 2015 | June 30, 2015 | — | — | 0.221181 | |||||||||||
| July 14, 2015 | July 24, 2015 | August 4, 2015 | 0.1484375 | 0.140625 | 0.135417 | |||||||||||
| July 14, 2015 | August 20, 2015 | August 31, 2015 | 0.1484375 | 0.140625 | 0.135417 | |||||||||||
| July 14, 2015 | September 21, 2015 | September 30, 2015 | 0.1484375 | 0.140625 | 0.135417 | |||||||||||
| October 13, 2015 | October 26, 2015 | November 4, 2015 | 0.1484375 | 0.140625 | 0.135417 | |||||||||||
| October 13, 2015 | November 17, 2015 | November 30, 2015 | 0.1484375 | 0.140625 | 0.135417 | |||||||||||
| October 13, 2015 | December 18, 2015 | December 31, 2015 | 0.1484375 | 0.140625 | 0.135417 | |||||||||||
| January 12, 2016 | January 22, 2016 | February 2, 2016 | 0.1484375 | 0.140625 | 0.135417 | |||||||||||
| January 12, 2016 | February 18, 2016 | February 29, 2016 | 0.1484375 | 0.140625 | 0.135417 | |||||||||||
| January 12, 2016 | March 21, 2016 | March 31, 2016 | 0.1484375 | 0.140625 | 0.135417 | |||||||||||
|
|
|
|
|
|
|
|||||||||||
| Total |
$ | 1.7812500 | $ | 1.687500 | $ | 1.439934 | ||||||||||
|
|
|
|
|
|
|
|||||||||||
| (B) | Represents a combined dividend for a prorated month of May 2015, based upon the issuance date of our Series C Term Preferred Stock, combined with a full month of June 2015. |
For the Year Ended March 31, 2015:
| Declaration Date |
Record Date |
Payment Date |
Dividend per Series A Term Preferred Share |
Dividend per Series B Term Preferred Share |
||||||||
| April 8, 2014 | April 21, 2014 | April 30, 2014 | $ | 0.1484375 | $ | — | ||||||
| April 8, 2014 | May 20, 2014 | May 30, 2014 | 0.1484375 | — | ||||||||
| April 8, 2014 | June 19, 2014 | June 30, 2014 | 0.1484375 | — | ||||||||
| July 15, 2014 | July 25, 2014 | August 5, 2014 | 0.1484375 | — | ||||||||
| July 15, 2014 | August 20, 2014 | August 29, 2014 | 0.1484375 | — | ||||||||
| July 15, 2014 | September 19, 2014 | September 30, 2014 | 0.1484375 | — | ||||||||
| October 7, 2014 | October 22, 2014 | October 31, 2014 | 0.1484375 | — | ||||||||
| October 7, 2014 | November 17, 2014 | November 26, 2014 | 0.1484375 | — | ||||||||
| October 7, 2014 | December 19, 2014 | December 31, 2014 | 0.1484375 | — | ||||||||
| November 24, 2014(C) | December 19, 2014 | December 31, 2015 | — | 0.225000 | ||||||||
| January 12, 2015 | January 23, 2015 | February 3, 2015 | 0.1484375 | 0.140625 | ||||||||
| January 12, 2015 | February 18, 2015 | February 27, 2015 | 0.1484375 | 0.140625 | ||||||||
| January 12, 2015 | March 20, 2015 | March 31, 2015 | 0.1484375 | 0.140625 | ||||||||
|
|
|
|
|
|||||||||
| Total |
$ | 1.7812500 | $ | 0.646875 | ||||||||
|
|
|
|
|
|||||||||
| (C) | Represents a combined dividend for a prorated month of November 2014, based upon the issuance date of our Series B Term Preferred Stock, combined with a full month of December 2014. |
The tax character of dividends paid by us to our preferred stockholders generally constitute ordinary income to the extent of our current and accumulated earnings and profits.
In accordance with ASC 480, “Distinguishing Liabilities from Equity,” mandatorily redeemable financial instruments should be classified as liabilities on the balance sheet and we have recorded our mandatorily redeemable preferred stock at cost, which equals the liquidation preference, less discounts, as of March 31, 2017 and 2016. The related dividend payments to preferred stockholders are treated as dividend expense on our accompanying Consolidated Statements of Operations on the ex-dividend date.
100
The following table summarizes the fair value of each of our series of mandatorily redeemable preferred stock based on the last reported closing sale price as of March 31, 2017 and 2016, each of which we consider to be a Level 1 input within the fair value hierarchy:
| Fair Value as of March 31, | ||||||||
| 2017 | 2016 | |||||||
| Series A Term Preferred Stock(A) |
$ | — | $ | 40,944 | ||||
| Series B Term Preferred Stock |
42,973 | 40,738 | ||||||
| Series C Term Preferred Stock |
41,216 | 38,849 | ||||||
| Series D Term Preferred Stock(B) |
58,719 | — | ||||||
|
|
|
|
|
|||||
| Total |
$ | 142,908 | $ | 120,531 | ||||
|
|
|
|
|
|||||
| (A) | We voluntarily redeemed all outstanding shares of our Series A Term Preferred Stock on September 30, 2016. |
| (B) | Our Series D Term Preferred Stock was issued on September 26, 2016. |
NOTE 7. REGISTRATION STATEMENT AND COMMON EQUITY OFFERINGS
Registration Statement
On June 16, 2015, we filed a registration statement on Form N-2 (File No. 333-204996) with the SEC and subsequently filed a Pre-Effective Amendment No. 1 thereto on July 28, 2015, which the SEC declared effective on July 29, 2015. On June 8, 2016, we filed Post-Effective Amendment No. 1 to the registration statement, which the SEC declared effective on July 28, 2016. The registration statement permits us to issue, through one or more transactions, up to an aggregate of $300.0 million in securities, consisting of common stock, preferred stock, subscription rights, debt securities, and warrants to purchase common or preferred stock, including through concurrent, separate offerings of such securities. As of March 31, 2017, we have the ability to issue up to $242.5 million in securities under the registration statement.
Common Equity Offering
On March 13, 2015, pursuant to our prior registration statement, we completed a public offering of 3.3 million shares of our common stock at a public offering price of $7.40 per share, which was below our then current NAV per share. Gross proceeds totaled $24.4 million and net proceeds, after deducting underwriting discounts and offering costs borne by us, were $23.0 million, which was used to repay borrowings under the Credit Facility. In April 2015, the underwriters exercised their option to purchase an additional 495,000 shares at the public offering price of $7.40 per share to cover over-allotments, which resulted in gross proceeds of $3.7 million and net proceeds, after deducting underwriting discounts and offering costs borne by us, of $3.4 million.
NOTE 8. NET INCREASE (DECREASE) IN NET ASSETS RESULTING FROM OPERATIONS PER WEIGHTED AVERAGE COMMON SHARE
The following table sets forth the computation of basic and diluted Net increase (decrease) in net assets resulting from operations per weighted average common share for the years ended March 31, 2017, 2016, and 2015:
| Year Ended March 31, | ||||||||||||
| 2017 | 2016 | 2015 | ||||||||||
| Numerator: net increase in net assets resulting from operations |
$ | 44,763 | $ | 24,854 | $ | 50,214 | ||||||
| Denominator: basic and diluted weighted average common shares |
30,270,958 | 30,268,253 | 26,665,821 | |||||||||
|
|
|
|
|
|
|
|||||||
| Basic and diluted net increase in net assets resulting from operations per weighted average common share |
$ | 1.48 | $ | 0.82 | $ | 1.88 | ||||||
|
|
|
|
|
|
|
|||||||
NOTE 9. DISTRIBUTIONS TO COMMON STOCKHOLDERS
To qualify to be taxed as a RIC under Subchapter M of the Code, we must generally distribute to our stockholders, for each taxable year, at least 90% of our Investment Company Taxable Income. The amount to be paid out as distributions to our common stockholders is determined by our Board of Directors quarterly and is based upon management’s estimate of the Investment Company Taxable Income. Based on that estimate, our Board of Directors declares three monthly distributions to common stockholders each quarter.
101
The federal income tax characteristics of all distributions (including preferred stock dividends) will generally be reported to stockholders on Internal Revenue Service Form 1099 after the end of each calendar year. For calendar years ended December 31, 2016, 2015 and 2014, 100% of distributions to common stockholders during these periods were deemed to be paid from ordinary income for 1099 stockholder reporting purposes.
We paid the following monthly distributions to our common stockholders for the years ended March 31, 2017, 2016 and 2015:
| Fiscal Year |
Declaration Date |
Record Date |
Payment Date |
Distribution | ||||
| 2017 |
April 12, 2016 | April 22, 2016 | May 2, 2016 | $0.0625 | ||||
| April 12, 2016 | May 19, 2016 | May 31, 2016 | 0.0625 | |||||
| April 12, 2016 | June 17, 2016 | June 30, 2016 | 0.0625 | |||||
| July 12, 2016 | July 22, 2016 | August 2, 2016 | 0.0625 | |||||
| July 12, 2016 | August 22, 2016 | August 31, 2016 | 0.0625 | |||||
| July 12, 2016 | September 21, 2016 | September 30, 2016 | 0.0625 | |||||
| October 11, 2016 | October 21, 2016 | October 31, 2016 | 0.0625 | |||||
| October 11, 2016 | November 17, 2016 | November 30, 2016 | 0.0625 | |||||
| October 11, 2016 | December 20, 2016 | December 30, 2016 | 0.0625 | |||||
| January 10, 2017 | January 20, 2017 | January 31, 2017 | 0.0625 | |||||
| January 10, 2017 | February 16, 2017 | February 28, 2017 | 0.0625 | |||||
| January 10, 2017 | March 22, 2017 | March 31, 2017 | 0.0625 | |||||
|
| ||||||||
| Year Ended March 31, 2017: | $0.75 | |||||||
|
| ||||||||
| Fiscal Year |
Declaration Date |
Record Date |
Payment Date |
Distribution | ||||
| 2016 |
April 14, 2015 | April 24, 2015 | May 5, 2015 | $0.0625 | ||||
| April 14, 2015 | May 19, 2015 | May 29, 2015 | 0.0625 | |||||
| April 14, 2015 | June 19, 2015 | June 30, 2015 | 0.0625 | |||||
| July 14, 2015 | July 24, 2015 | August 4, 2015 | 0.0625 | |||||
| July 14, 2015 | August 20, 2015 | August 31, 2015 | 0.0625 | |||||
| July 14, 2015 | September 21, 2015 | September 30, 2015 | 0.0625 | |||||
| October 13, 2015 | October 26, 2015 | November 4, 2015 | 0.0625 | |||||
| October 13, 2015 | November 17, 2015 | November 30, 2015 | 0.0625 | |||||
| October 13, 2015 | December 18, 2015 | December 31, 2015 | 0.0625 | |||||
| January 12, 2016 | January 22, 2016 | February 2, 2016 | 0.0625 | |||||
| January 12, 2016 | February 18, 2016 | February 29, 2016 | 0.0625 | |||||
| January 12, 2016 | March 21, 2016 | March 31, 2016 | 0.0625 | |||||
|
| ||||||||
| Year Ended March 31, 2016: | $0.75 | |||||||
|
| ||||||||
| Fiscal Year |
Declaration Date | Record Date | Payment Date | Distribution per Common Share |
||||||||
| 2015 |
April 8, 2014 | April 21, 2014 | April 30, 2014 | $ | 0.06 | |||||||
| April 8, 2014 | May 20, 2014 | May 30, 2014 | 0.06 | |||||||||
| April 8, 2014 | June 19, 2014 | June 30, 2014 | 0.06 | |||||||||
| July 15, 2014 | July 25, 2014 | August 5, 2014 | 0.06 | |||||||||
| July 15, 2014 | August 20, 2014 | August 29, 2014 | 0.06 | |||||||||
| July 15, 2014 | September 19, 2014 | September 30, 2014 | 0.06 | |||||||||
| October 7, 2014 | October 22, 2014 | October 31, 2014 | 0.06 | |||||||||
| October 7, 2014 | November 17, 2014 | November 26, 2014 | 0.06 | |||||||||
| October 7, 2014 | December 19, 2014 | December 31, 2014 | 0.06 | |||||||||
| October 7, 2014 | December 19, 2014 | December 31, 2014 | 0.05 | (A) | ||||||||
| January 13, 2015 | January 23, 2015 | February 3, 2015 | 0.06 | |||||||||
| January 13, 2015 | February 18, 2015 | February 27, 2015 | 0.06 | |||||||||
| January 13, 2015 | March 20, 2015 | March 31, 2015 | 0.06 | |||||||||
|
|
|
|||||||||||
| Year Ended March 31, 2015: | $ | 0.77 | ||||||||||
|
|
|
|||||||||||
| (A) | Represents a supplemental distribution of $0.05 per share of common stock. |
Aggregate distributions to our common stockholders declared quarterly and paid for the years ended March 31, 2017, 2016 and 2015 were approximately $22.7 million, $22.7 million, and $20.6 million, respectively, and were declared based on estimates of Investment
102
Company Taxable Income for the respective fiscal years. For each of the fiscal years ended March 31, 2017, 2016, and 2015, Investment Company Taxable Income exceeded distributions declared and paid, and, in accordance with Section 855(a) of the Code, we elected to treat $8.2 million, $6.9 million, and $3.9 million, respectively, of the first distributions paid to common stockholders in the respective subsequent fiscal year as having been paid in the respective prior year.
The components of our net assets on a tax basis were as follows:
| Year Ended March 31, | ||||||||
| 2017 | 2016 | |||||||
| Common stock |
$ | 30 | $ | 30 | ||||
| Capital in excess of par value |
310,332 | 311,608 | ||||||
| Cumulative unrealized depreciation of investments |
(23,590 | ) | (30,469 | ) | ||||
| Cumulative unrealized depreciation of other |
— | (75 | ) | |||||
| Undistributed ordinary income |
8,210 | 6,878 | ||||||
| Undistributed capital gain |
2,316 | — | ||||||
| Capital loss carryforward |
— | (13,604 | ) | |||||
| Other temporary differences |
3,784 | 4,654 | ||||||
|
|
|
|
|
|||||
| Net Assets |
$ | 301,082 | $ | 279,022 | ||||
|
|
|
|
|
|||||
We may retain some or all of our net long-term capital gains, if any, but we generally intend to distribute such gains to stockholders in cash or to designate them as deemed distributions. We had no deemed distributions during the years ended March 31, 2017, 2016, and 2015.
For the years ended March 31, 2017 and 2016, we recorded the following adjustments for permanent book-tax differences to reflect tax character. Results of operations, total net assets, and cash flows were not affected by these adjustments.
| Tax Year Ended March 31, |
||||||||
| 2017 | 2016 | |||||||
| Undistributed net investment income |
$ | 1,138 | $ | 1,712 | ||||
| Accumulated net realized gain (loss) |
138 | (441 | ) | |||||
|
Paid-in-capital |
(1,276 | ) | (1,271 | ) | ||||
NOTE 10. FEDERAL AND STATE INCOME TAXES
We intend to continue to maintain our qualifications as a RIC for federal income tax purposes. As a RIC, we are generally not subject to federal income tax on the portion of our taxable income and gains that we distribute to stockholders. To maintain our qualification as a RIC, we must maintain our status as a BDC and meet certain source-of-income and asset diversification requirements. In addition, in order to qualify to be taxed as a RIC, we must distribute to stockholders at least 90% of our Investment Company Taxable Income. Our policy generally is to make distributions to our stockholders in an amount up to 100% of our Investment Company Taxable Income. Because we have distributed more than 90% of our Investment Company Taxable Income, no income tax provisions have been recorded for the years ended March 31, 2017, 2016, and 2015.
In an effort to limit certain federal excise taxes imposed on RICs, we generally distribute to our stockholders, during each calendar year, an amount close to the sum of (1) 98% of our ordinary income for the calendar year, (2) 98.2% of our capital gains in excess of capital losses for the one-year period ending on October 31 of the calendar year and (3) any ordinary income and capital gains in excess of capital losses for preceding years that were not distributed during such years. We incurred an excise tax of $0.4 million, $0.2 million, and $0.1 million for the calendar years ended December 31, 2016, 2015 and 2014, respectively.
Under the RIC Modernization Act, we are permitted to carryforward capital losses incurred in taxable years beginning after March 31, 2011, for an unlimited period. Additionally, post-enactment capital loss carryforwards will retain their character as either short-term or long-term capital losses rather than being considered all short-term as permitted under the Treasury regulations applicable to pre-enactment capital loss carryforwards. Our capital loss carryforward balance as of March 31, 2017 and 2016 was $0 and $13.6 million, respectively.
103
NOTE 11. COMMITMENTS AND CONTINGENCIES
Legal Proceedings
We are party to certain legal proceedings incidental to the normal course of our business. We are required to establish reserves for litigation matters where those matters present loss contingencies that are both probable and estimable. When loss contingencies are not both probable and estimable, we do not establish reserves. Based on current knowledge, we do not believe that loss contingencies, if any, arising from pending investigations, litigation or regulatory matters will have a material adverse effect on our financial condition, results of operation or cash flows. Additionally, based on our current knowledge, we do not believe such loss contingencies are both probable and estimable and therefore, as of March 31, 2017 and 2016, we had no established reserves for such loss contingencies.
Escrow Holdbacks
From time to time, we will enter into arrangements relating to exits of certain investments whereby specific amounts of the proceeds are held in escrow to be used to satisfy potential obligations, as stipulated in the sales agreements. We record escrow amounts in Restricted cash and cash equivalents, if received in cash but subject to potential obligations or other contractual restrictions, or as escrow receivables in Other assets, net, if not yet received in cash, on our accompanying Consolidated Statements of Assets and Liabilities. We establish reserves and holdbacks against escrow amounts if we determine that it is probable and estimable that a portion of the escrow amounts will not ultimately be released or received at the end of the escrow period. Reserves and holdbacks against escrow amounts were $0.5 million as of March 31, 2017. There were no aggregate reserves or holdbacks recorded against escrow amounts as of March 31, 2016.
Financial Commitments and Obligations
We have lines of credit and other uncalled capital commitments to certain of our portfolio companies that have not been fully drawn. Since these lines of credit and other uncalled capital commitments have expiration dates and we expect many will never be fully drawn, the total line of credit and other uncalled capital commitment amounts do not necessarily represent future cash requirements. In February 2015, we executed a capital call commitment with Tread and its senior credit facility lender, which expires in February 2018. Under the terms of the agreement, we may be required to fund additional capital up to $10.0 million in Tread, with such commitment limited at all times to the actual amount outstanding under Tread’s senior credit facility. The actual amount outstanding under Tread’s senior credit facility as of March 31, 2017 and 2016 was $0 and $5.1 million, respectively. We estimate the fair value of the combined unused line of credit and other uncalled capital commitments as of March 31, 2017 and 2016 to be immaterial.
In addition to the lines of credit and other uncalled capital commitments to our portfolio companies, we have also extended a guaranty on behalf of one of our portfolio companies. During the years ended March 31, 2017 and 2016, we have not been required to make any payments on this guaranty, or any guaranties that existed in previous periods, and we consider the credit risks to be remote and the fair value of the guaranties as of March 31, 2017 and 2016 to be immaterial.
As of March 31, 2017, the following guaranty was outstanding:
| • | In February 2010, we executed a guaranty of a wholesale financing facility agreement (the “Floor Plan Facility”) between Agricredit Acceptance, LLC (“Agricredit”) and Country Club Enterprises, LLC (“CCE”). The Floor Plan Facility provides CCE with financing of up to $2.0 million to bridge the time and cash flow gap between the order and delivery of golf carts to customers. The guaranty was renewed in February of each subsequent year through February 2017 and expires in February 2018, unless it is renewed again by us, CCE and Agricredit. |
The following table summarizes the principal balances of unused line of credit and other uncalled capital commitments and guaranties as of March 31, 2017 and 2016, which are not reflected as liabilities in the accompanying Consolidated Statements of Assets and Liabilities:
| As of March 31, | ||||||||
| 2017 | 2016 | |||||||
| Unused line of credit and other uncalled capital commitments |
$ | 2,884 | $ | 10,564 | ||||
| Guaranties |
2,000 | 2,279 | ||||||
|
|
|
|
|
|||||
| Total |
$ | 4,884 | $ | 12,843 | ||||
|
|
|
|
|
|||||
104
NOTE 12. FINANCIAL HIGHLIGHTS
| As of and for the Year Ended March 31, | ||||||||||||||||||||
| 2017 | 2016 | 2015 | 2014 | 2013 | ||||||||||||||||
| Per Common Share Data: |
||||||||||||||||||||
| Net asset value, at beginning of |
$ | 9.22 | $ | 9.18 | $ | 8.34 | $ | 9.10 | $ | 9.38 | ||||||||||
| Income from investment operations(B) |
||||||||||||||||||||
| Net investment income |
0.74 | 0.68 | 0.75 | 0.73 | 0.68 | |||||||||||||||
| Net realized gain (loss) on sale of investments and other |
0.51 | (0.15 | ) | — | 0.31 | 0.03 | ||||||||||||||
| Net unrealized appreciation (depreciation) of investments and other |
0.23 | 0.29 | 1.13 | (1.09 | ) | — | ||||||||||||||
|
|
|
|
|
|
|
|
|
|
|
|||||||||||
| Total from investment operations |
1.48 | 0.82 | 1.88 | (0.05 | ) | 0.71 | ||||||||||||||
|
|
|
|
|
|
|
|
|
|
|
|||||||||||
| Effect of equity capital activity(B) |
||||||||||||||||||||
| Cash distributions to common stockholders from net investment income(C) |
(0.75 | ) | (0.64 | ) | (0.77 | ) | (0.71 | ) | (0.60 | ) | ||||||||||
| Cash distributions to common stockholders from realized gains(C) |
— | (0.11 | ) | — | — | — | ||||||||||||||
| Shelf registration offering costs |
— | (0.01 | ) | (0.03 | ) | — | (0.08 | ) | ||||||||||||
| Net dilutive effect of equity offering(D) |
— | (0.03 | ) | (0.22 | ) | — | (0.31 | ) | ||||||||||||
|
|
|
|
|
|
|
|
|
|
|
|||||||||||
| Total from equity capital activity |
(0.75 | ) | (0.79 | ) | (1.02 | ) | (0.71 | ) | (0.99 | ) | ||||||||||
|
|
|
|
|
|
|
|
|
|
|
|||||||||||
| Other, net(B)(E) |
— | 0.01 | (0.02 | ) | — | — | ||||||||||||||
|
|
|
|
|
|
|
|
|
|
|
|||||||||||
| Net asset value at end of year(A) |
$ | 9.95 | $ | 9.22 | $ | 9.18 | $ | 8.34 | $ | 9.10 | ||||||||||
|
|
|
|
|
|
|
|
|
|
|
|||||||||||
| Per common share market value at beginning of year |
$ | 7.02 | $ | 7.40 | $ | 8.27 | $ | 7.31 | $ | 7.57 | ||||||||||
| Per common share market value at end of year |
9.07 | 7.02 | 7.40 | 8.27 | 7.31 | |||||||||||||||
| Total investment return(F) |
41.58 | % | 4.82 | % | 11.96 | % | 24.26 | % | 4.73 | % | ||||||||||
| Common stock outstanding at end of year(A) |
30,270,958 | 30,270,958 | 29,775,958 | 26,475,958 | 26,475,958 | |||||||||||||||
| Statement of Assets and Liabilities Data: |
||||||||||||||||||||
| Net assets at end of year |
$ | 301,082 | $ | 279,022 | $ | 273,429 | $ | 220,837 | $ | 240,963 | ||||||||||
| Average net assets(G) |
294,030 | 276,293 | 229,350 | 231,356 | 216,751 | |||||||||||||||
| Senior Securities Data: |
||||||||||||||||||||
| Total borrowings, at cost |
$ | 74,796 | $ | 100,096 | $ | 123,896 | $ | 66,250 | $ | 94,016 | ||||||||||
| Mandatorily redeemable preferred stock(H) |
139,150 | 121,650 | 81,400 | 40,000 | 40,000 | |||||||||||||||
| Ratios/Supplemental Data: |
||||||||||||||||||||
| Ratio of net expenses to average net assets(I) |
10.02 | % | 10.94 | % | 9.48 | % | 7.33 | % | 6.48 | % | ||||||||||
| Ratio of net investment income to average net assets(J) |
7.63 | 7.50 | 8.68 | 8.35 | 7.61 | |||||||||||||||
| (A) | Based on actual shares outstanding at the end of the corresponding year. |
| (B) | Based on weighted average basic common share data for the corresponding year. |
| (C) | The tax character of distributions is determined based on taxable income calculated in accordance with income tax regulations, which may differ from amounts determined under GAAP. |
| (D) | During the years ended March 31, 2016, 2015 and 2013, the dilution is the result of issuing common shares at a price below then current NAV. |
| (E) | Represents the impact of the different share amounts (weighted average basic common shares outstanding for the corresponding year and actual common shares outstanding at the end of the year) in the Per Common Share Data calculations and rounding impacts. |
| (F) | Total return equals the change in the market value of our common stock from the beginning of the year, taking into account dividends reinvested in accordance with the terms of our dividend reinvestment plan. Total return does not take into account distributions that may be characterized as a return of capital. For further information on the estimated character of our distributions to common stockholders, please refer to Note 9—Distributions to Common Stockholders. |
| (G) | Calculated using the average balance of net assets at the end of each month of the reporting year. |
| (H) | Represents the total liquidation preference of our mandatorily redeemable preferred stock. |
| (I) | Ratio of net expenses to average net assets is computed using total expenses, net of any non-contractual, unconditional, and irrevocable credits of fees from the Adviser. Had we not received any non-contractual, unconditional, and irrevocable credits of fees from the Adviser, the ratio of expenses to average net assets would have been 13.46%, 14.50%, 12.90%, 10.20%, and 8.81% for the fiscal years ended March 31, 2017, 2016, 2015, 2014, and 2013, respectively. |
| (J) | Had we not received any non-contractual, unconditional, and irrevocable credits of fees from the Adviser, the ratio of net investment income to average net assets would have been 4.19%, 3.94%, 5.26%, 5.48%, and 5.28% for the fiscal years ended March 31, 2017, 2016, 2015, 2014, and 2013, respectively. |
105
NOTE 13. SELECTED QUARTERLY DATA (UNAUDITED)
| Quarter Ended | ||||||||||||||||
| Year ended March 31, 2017 |
June 30, 2016 | September 30, 2016 | December 31, 2016 | March 31, 2017 | ||||||||||||
| Total investment income |
$ | 14,393 | $ | 11,744 | $ | 13,374 | $ | 12,364 | ||||||||
| Net investment income |
6,812 | 5,112 | 5,204 | 5,294 | ||||||||||||
| Net increase (decrease) in net assets resulting from operations |
24,534 | (102 | ) | 10,955 | 9,376 | |||||||||||
| Net increase (decrease) in net assets resulting from operations per weighted average common share – basic & diluted |
$ | 0.81 | $ | — | $ | 0.36 | $ | 0.31 | ||||||||
| Quarter Ended | ||||||||||||||||
| Year ended March 31, 2016 |
June 30, 2015 | September 30, 2015 | December 31, 2015 | March 31, 2016 | ||||||||||||
| Total investment income |
$ | 12,706 | $ | 13,740 | $ | 12,068 | $ | 12,441 | ||||||||
| Net investment income |
5,163 | 6,023 | 4,631 | 4,899 | ||||||||||||
| Net increase (decrease) in net assets resulting from operations |
8,559 | (110 | ) | (6,213 | ) | 22,618 | ||||||||||
| Net increase (decrease) in net assets resulting from operations per weighted average common share – basic & diluted |
$ | 0.29 | $ | — | $ | (0.21 | ) | $ | 0.74 | |||||||
NOTE 14. UNCONSOLIDATED SIGNIFICANT SUBSIDIARIES
In accordance with the SEC’s Regulation S-X, we do not consolidate portfolio company investments. Further, in accordance with ASC 946, we are precluded from consolidating any entity other than another investment company, except that ASC 946 provides for the consolidation of a controlled operating company that provides substantially all of its services to the investment company or its consolidated subsidiaries.
We had one unconsolidated subsidiary, Galaxy Tool Holding Corporation, which met at least one of the significance conditions under Rule 1-02(w) of the SEC’s Regulation S-X as of or during at least one of the years ended March 31, 2017, 2016 and 2015. Accordingly, audited and unaudited financial statements, as applicable, for this subsidiary have been included as exhibits to this Form 10-K pursuant to Rule 3-09.
NOTE 15. SUBSEQUENT EVENTS
Common stock offering
In May 2017, we completed a public offering of 2.1 million shares of our common stock at a public offering price of $9.38 per share, which was below our then current estimated NAV of $9.95 per share. Gross proceeds totaled $19.7 million and net proceeds, after deducting underwriting discounts and commissions and estimated offering costs borne by us, were $18.6 million, which was used to repay borrowings under the Credit Facility and other general corporate purposes. The underwriters also have a 30-day option expiring on June 8, 2017 to purchase up to 315,000 additional shares of common stock on the same terms and conditions solely to cover over-allotments, if any.
Distributions and dividends
In April 2017, our Board of Directors declared the following monthly and supplemental distributions to common stockholders and monthly dividends to holders of our Series B Term Preferred Stock, Series C Term Preferred Stock, and Series D Term Preferred Stock:
| Record Date |
Payment Date |
Distribution per Common Share |
Dividend per Series B Term Preferred Share |
Dividend per Series C Term Preferred Share |
Dividend per Series D Term Preferred Share |
|||||||||||||
| April 21, 2017 |
April 28, 2017 | $ | 0.064 | $ | 0.140625 | $ | 0.135417 | $ | 0.13020833 | |||||||||
| May 19, 2017 |
May 31, 2017 | 0.064 | 0.140625 | 0.135417 | 0.13020833 | |||||||||||||
| June 5, 2017 |
June 15, 2017 | 0.060 | (A) | — | — | — | ||||||||||||
| June 21, 2017 |
June 30, 2017 | 0.064 | 0.140625 | 0.135417 | 0.13020833 | |||||||||||||
|
|
|
|
|
|
|
|
|
|||||||||||
| Total for the Quarter: |
$ | 0.252 | $ | 0.421875 | $ | 0.406251 | $ | 0.39062499 | ||||||||||
|
|
|
|
|
|
|
|
|
|||||||||||
| (A) | Denotes supplemental distribution to common stockholders. |
106
Investment Activity
| • | In April 2017, we sold our investment in Mitchell Rubber Products, Inc., which had a cost basis and fair value of $16.4 million and $19.2 million, respectively, as of March 31, 2017. In connection with the sale, we received net cash proceeds of $19.0 million, including the repayment of our debt investment of $13.6 million at par. |
107
ITEM 9. CHANGES IN AND DISAGREEMENTS WITH ACCOUNTANTS ON ACCOUNTING AND FINANCIAL DISCLOSURE
Not applicable.
ITEM 9A. CONTROLS AND PROCEDURES
a) Disclosure Controls and Procedures
As of March 31, 2017 (the end of the period covered by this report), we, including our chief executive officer and chief financial officer, evaluated the effectiveness and design and operation of our disclosure controls and procedures. Based on that evaluation, our management, including the chief executive officer and chief financial officer, concluded that our disclosure controls and procedures were effective at a reasonable assurance level in timely alerting management, including the chief executive officer and chief financial officer, of material information about us required to be included in periodic SEC filings. However, in evaluation of the disclosure controls and procedures, management recognized that any controls and procedures, no matter how well designed and operated, can provide only reasonable assurance of achieving the desired control objectives, and management necessarily was required to apply its judgment in evaluating the cost-benefit relationship of possible controls and procedures.
b) Management’s Annual Report on Internal Control over Financial Reporting
Refer to Management’s Annual Report on Internal Control over Financial Reporting located in Item 8 of this Form 10-K.
c) Attestation Report of the Independent Registered Public Accounting Firm
Refer to the Report of Independent Registered Public Accounting Firm located in Item 8 of this Form 10-K.
d) Change in Internal Control over Financial Reporting
There were no changes in internal controls for the three months ended March 31, 2017 that have materially affected, or are reasonably likely to materially affect, our internal control over financial reporting.
Not applicable.
108
PART III
We will file a definitive Proxy Statement for our 2017 Annual Meeting of Stockholders (the “2017 Proxy Statement”) with the SEC, pursuant to Regulation 14A, not later than 120 days after the end of our fiscal year. Accordingly, certain information required by Part III has been omitted under General Instruction G(3) to Form 10-K. Only those sections of the 2017 Proxy Statement that specifically address the items set forth herein are incorporated by reference.
ITEM 10. DIRECTORS, EXECUTIVE OFFICERS AND CORPORATE GOVERNANCE
The information required by Item 10 is hereby incorporated by reference from our 2017 Proxy Statement under the captions “Election of Directors,” “Information Regarding the Board of Directors and Corporate Governance,” and “Section 16(a) Beneficial Ownership Reporting Compliance.”
ITEM 11. EXECUTIVE COMPENSATION
The information required by Item 11 is hereby incorporated by reference from our 2017 Proxy Statement under the captions “Executive Compensation” and “Director Compensation For Fiscal 2017.”
ITEM 12. SECURITY OWNERSHIP OF CERTAIN BENEFICIAL OWNERS AND MANAGEMENT AND RELATED STOCKHOLDER MATTERS
The information required by Item 12 is hereby incorporated by reference from our 2017 Proxy Statement under the caption “Security Ownership of Certain Beneficial Owners and Management.”
ITEM 13. CERTAIN RELATIONSHIPS AND RELATED TRANSACTIONS, AND DIRECTOR INDEPENDENCE
The information required by Item 13 is hereby incorporated by reference from our 2017 Proxy Statement under the captions “Certain Transactions” and “Information Regarding the Board of Directors and Corporate Governance.”
ITEM 14. PRINCIPAL ACCOUNTANT FEES AND SERVICES
The information required by Item 14 is hereby incorporated by reference from our 2017 Proxy Statement under the caption “Independent Registered Public Accounting Firm Fees.”
109
PART IV
ITEM 15. EXHIBITS AND FINANCIAL STATEMENT SCHEDULES
| a. | DOCUMENTS FILED AS PART OF THIS REPORT | |
| 1. | The following financial statements are filed herewith: | |
| 2. | The following financial statement schedule is filed herewith: | |
| 113 | ||||||
| No other financial statement schedules are filed herewith because (1) such schedules are not required or (2) the information has been presented in the aforementioned financial statements. | ||
| 3. | Exhibits | |
| The following exhibits are filed as part of this report or hereby incorporated by reference to exhibits previously filed with the SEC: | ||
| 3.1 | Amended and Restated Certificate of Incorporation, incorporated by reference to Exhibit a.2 to Pre-Effective Amendment No. 1 to the Registration Statement on Form N-2 (File No. 333-123699), filed May 13, 2005. | |
| 3.1.a | Certificate of Designation of 6.75% Series B Cumulative Term Preferred Stock, incorporated by reference to Exhibit 3.3 to the Registration Statement on Form 8-A (File No. 001-34007), filed November 7, 2014. | |
| 3.1.b | Certificate of Designation of 6.50% Series C Cumulative Term Preferred Stock, incorporated by reference to Exhibit 3.4 to the Registration Statement on Form 8-A (File No. 001-34007), filed May 11, 2015. | |
| 3.1.c | Certificate of Amendment to the Certificate of Designation of 6.75% Series B Cumulative Term Preferred Stock, incorporated by reference to Exhibit 3.6 to the Quarterly Report on Form 10-Q (File No. 814-00704), filed August 4, 2015. | |
| 3.1.d | Certificate of Designation of 6.25% Series D Cumulative Term Preferred Stock, incorporated by reference to Exhibit 3.5 to the Registration Statement on Form 8-A (File No. 001-34007), filed September 22, 2016. | |
| 3.1.e | Certificate of Elimination of 7.125% Series A Cumulative Term Preferred Stock, incorporated by reference to Exhibit 3.1 to the Current Report on Form 8-K (File No. 811-23191), filed January 11, 2017. | |
| 3.2 | Amended and Restated Bylaws, incorporated by reference to Exhibit b.2 to the Pre-Effective Amendment No. 3 to the Registration Statement on Form N-2 (File No. 333-123699), filed June 21, 2005. | |
| 3.3 | First Amendment to Amended and Restated Bylaws, incorporated by reference to Exhibit 99.1 to the Current Report on Form 8-K (File No. 814-00704) filed July 10, 2007. | |
| 4.1 | Specimen Stock Certificate, incorporated by reference to Exhibit d to Pre-Effective Amendment No. 3 to the Registration Statement on Form N-2 (File No. 333-123699), filed June 21, 2005. | |
| 4.2 | Specimen 6.75% Series B Cumulative Term Preferred Stock Certificate, incorporated by reference to Exhibit 4.3 to the Registration Statement on Form 8-A (File No. 001-34007), filed November 7, 2014. | |
| 4.3 | Specimen 6.50% Series C Cumulative Term Preferred Stock Certificate, incorporated by reference to Exhibit 4.4 to the Registration Statement on Form 8-A (File No. 001-34007), filed May 11, 2015. | |
| 4.4 | Specimen 6.25% Series D Cumulative Term Preferred Stock Certificate, incorporated by reference to Exhibit 4.5 to the Registration Statement on Form 8-A (File No. 001-34007), filed September 22, 2016. | |
| 10.1 | Investment Advisory and Management Agreement between the Registrant and Gladstone Management Corporation, dated June 22, 2005, incorporated by reference to Exhibit 10.1 to the Annual Report on Form 10-K (File No. 814-00704), filed June 14, 2006. | |
| 10.2 | Administration Agreement between the Registrant and Gladstone Administration, LLC, dated June 22, 2005, incorporated by reference to Exhibit 10.2 to the Annual Report on Form 10-K (File No. 814-00704), filed June 14, 2006. | |
| 10.3 | Stock Transfer Agency Agreement between the Registrant and The Bank of New York, incorporated by reference to Exhibit k to Pre-Effective Amendment No. 1 to the Registration Statement on Form N-2 (File No. 333-123699), filed May 13, 2005. | |
| 10.4 | Custody Agreement between the Registrant and The Bank of New York, incorporated by reference to Exhibit j to Pre-Effective Amendment No. 3 to the Registration Statement on Form N-2 (File No. 333-123699), filed June 21, 2005. | |
| 10.5 | Custodial Agreement by and among Gladstone Business Investment, LLC, the Registrant, Gladstone Management Corporation, The Bank of New York Trust Company, N.A. and Deutsche Bank AG, New York Branch, dated October 19, 2006, incorporated by reference to Exhibit 2.j.2 to Post-Effective Amendment No. 2 to the Registration Statement on Form N-2 (File No. 333-181879), filed June 7, 2013. | |
110
| 10.6 | Amendment No. 1 to Custodial Agreement by and among Gladstone Business Investment, LLC, the Registrant, Gladstone Management Corporation, The Bank of New York Trust Company, N.A. and Deutsche Bank AG, New York Branch, dated April 14, 2009, incorporated by reference to Exhibit 2.j.3 to Post-Effective Amendment No. 2 to the Registration Statement on Form N-2 (File No. 333-181879), filed June 7, 2013. | |
| 10.7 | Fifth Amended and Restated Credit Agreement, dated as of April 30, 2013, by and among Gladstone Business Investment, LLC, Gladstone Management Corporation, the Financial Institutions as party thereto, and Key Equipment Finance, Inc., incorporated by reference to Exhibit 10.1 to the Current Report on Form 8-K (File No. 814-00704), filed May 2, 2013. | |
| 10.8 | Joinder Agreement, dated as of June 12, 2013, by and among the Gladstone Business Investment, LLC, Gladstone Management Corporation, Key Equipment Finance Inc. and EverBank Commercial Finance, Inc., incorporated by reference to Exhibit 10.1 to the Current Report on Form 8-K (File No. 814-00704), filed June 17, 2013. | |
| 10.9 | Joinder Agreement, dated as of June 12, 2013, by and among Gladstone Business Investment, LLC, Gladstone Management Corporation, Key Equipment Finance Inc. and AloStar Bank of Commerce, incorporated by reference to Exhibit 10.2 of the Current Report on Form 8-K (File No. 814-00704), filed June 17, 2013. | |
| 10.10 | Amendment No. 1 to Fifth Amended and Restated Credit Agreement, dated as of June 26, 2014, by and among Gladstone Business Investment, LLC, Gladstone Management Corporation, the Financial Institutions as party thereto, and Key Equipment Finance, a division of KeyBank National Association, by reference to Exhibit 10.1 to the Current Report on Form 8-K (File No. 814-00704), filed June 30, 2014. | |
| 10.11 | Joinder Agreement, dated as of September 19, 2014, by and among Gladstone Business Investment, LLC, Gladstone Management Corporation, Key Equipment Finance, a division of KeyBank National Association, and East West Bank, incorporated by reference to Exhibit 10.1 to the Current Report on Form 8-K (File No. 814-00704), filed September 22, 2014. | |
| 10.12 | Joinder Agreement, dated as of September 19, 2014, by and among the Gladstone Business Investment, LLC, Gladstone Management Corporation, Key Equipment Finance, a division of KeyBank National Association, and Manufacturers and Traders Trust, incorporated by reference to Exhibit 10.2 to the Current Report on Form 8-K (File No. 814-00704), filed September 22, 2014. | |
| 10.13 | Joinder Agreement, dated as of September 19, 2014, by and among Gladstone Business Investment, LLC, Gladstone Management Corporation, Key Equipment Finance, a division of KeyBank National Association, and Customers Bank, incorporated by reference to Exhibit 10.3 to the Current Report on Form 8-K (File No. 814-00704), filed September 22, 2014. | |
| 10.14 | Joinder Agreement, dated as of September 19, 2014, by and among Gladstone Business Investment, LLC, Gladstone Management Corporation, Key Equipment Finance, a division of KeyBank National Association, and Talmer Bank and Trust, incorporated by reference to Exhibit 10.4 to the Current Report on Form 8-K (File No. 814-00704), filed September 22, 2014. | |
| 10.15 | Amendment No. 2 to Fifth Amended and Restated Credit Agreement, dated November 16, 2016, by and among Gladstone Business Investment, LLC, Gladstone Management Corporation, Keybank National Association, AloStar Bank of Commerce, Manufacturers and Traders Trust, East West Bank, Chemical Bank (as successor in interest to Talmer Bank and Trust) and Customers Bank, incorporated by reference to Exhibit 10.1 to the Current Report on Form 8-K (File No. 811-23191), filed November 17, 2016. | |
| 10.16 | Amendment No. 3 to Fifth Amended and Restated Credit Agreement, dated January 20, 2017, by and among Gladstone Business Investment, LLC, Gladstone Management Corporation, Keybank National Association, AloStar Bank of Commerce, Manufacturers and Traders Trust, East West Bank, Chemical Bank (as successor in interest to Talmer Bank and Trust) and Customers Bank, incorporated by reference to Exhibit 2.k.12 to Post-Effective Amendment No. 3 to the Registration Statement on Form N-2 (File No. 333-204996), filed May 11, 2017. | |
| 11 | Computation of Per Share Earnings (included in the notes to the audited financial statements contained in this report). | |
| 12* | Statements re: Computation of Ratios | |
| 14 | Code of Ethics and Business Conduct, updated January 28, 2013, incorporated by reference to Exhibit 2.r to the Post-Effective Amendment No. 2 to the Registration Statement on Form N-2 (File No. 333-181979), filed June 7, 2013. | |
| 21* | Subsidiaries of the Registrant. | |
| 31.1* | Certification of Chief Executive Officer filed pursuant to section 302 of The Sarbanes-Oxley Act of 2002. | |
| 31.2* | Certification of Chief Financial Officer filed pursuant to section 302 of The Sarbanes-Oxley Act of 2002. | |
| 32.1† | Certification of Chief Executive Officer furnished pursuant to section 906 of The Sarbanes-Oxley Act of 2002. | |
| 32.2† | Certification of Chief Financial Officer furnished pursuant to section 906 of The Sarbanes-Oxley Act of 2002. | |
| 99.1* | Financial Statements of Galaxy Tool Holding Corporation and Subsidiary as of and for the years ended December 31, 2016 and 2015. | |
| 99.2* | Financial Statements of Galaxy Tool Holding Corporation and Subsidiary as of and for the years ended December 31, 2014 and 2013 (unaudited). | |
| * | Filed herewith |
| † | Furnished herewith |
None.
111
Pursuant to the requirements of Section 13 or 15(d) of the Securities Exchange Act of 1934, the registrant has duly caused this report to be signed on its behalf by the undersigned, thereunto duly authorized.
| GLADSTONE INVESTMENT CORPORATION | ||||||
| Date: May 15, 2017 | By: | /s/ JULIA RYAN | ||||
| Julia Ryan | ||||||
| Chief Financial Officer and Treasurer | ||||||
Pursuant to the requirements of the Securities Exchange Act of 1934, this report has been signed below by the following persons on behalf of the registrant and in the capacities and on the dates indicated.
| Date: May 15, 2017 | By: | /s/ DAVID GLADSTONE | ||||
| David Gladstone | ||||||
| Chief Executive Officer and Chairman of the Board of Directors (principal executive officer) | ||||||
| Date: May 15, 2017 | By: | /s/ TERRY LEE BRUBAKER | ||||
| Terry Lee Brubaker | ||||||
| Vice Chairman and Chief Operating Officer | ||||||
| Date: May 15, 2017 | By: | /s/ JULIA RYAN | ||||
| Julia Ryan | ||||||
| Chief Financial Officer and Treasurer (principal financial and accounting officer) | ||||||
| Date: May 15, 2017 | By: | /s/ ANTHONY W. PARKER | ||||
| Anthony W. Parker | ||||||
| Director | ||||||
| Date: May 15, 2017 | By: | /s/ MICHELA A. ENGLISH | ||||
| Michela A. English | ||||||
| Director | ||||||
| Date: May 15, 2017 | By: | /s/ PAUL ADELGREN | ||||
| Paul Adelgren | ||||||
| Director | ||||||
| Date: May 15, 2017 | By: | /s/ JOHN H. OUTLAND | ||||
| John H. Outland | ||||||
| Director | ||||||
| Date: May 15, 2017 | By: | /s/ CAREN D. MERRICK | ||||
| Caren D. Merrick | ||||||
| Director | ||||||
| Date: May 15, 2017 | By: | /s/ WALTER H. WILKINSON, JR. | ||||
| Walter H. Wilkinson, Jr. | ||||||
| Director | ||||||
112
GLADSTONE INVESTMENT CORPORATION
INVESTMENTS IN AND ADVANCES TO AFFILIATES
(AMOUNTS IN THOUSANDS)
| Name of Issuer(A) |
Title of Issue or |
Amount of |
Value as of 2016 |
Gross |
Gross |
Value as of |
||||||||||||||||
| CONTROL INVESTMENTS |
||||||||||||||||||||||
| Galaxy Tool Holding Corporation |
Secured First Lien Line of Credit | $ | 311 | $ | 5,000 | $ | 300 | $ | (500 | ) | $ | 4,800 | ||||||||||
| Secured Second Lien Term Loan | 507 | 5,000 | — | — | 5,000 | |||||||||||||||||
| Preferred Stock | — | — | 6,242 | — | 6,242 | |||||||||||||||||
| Common Stock | — | — | — | — | — | |||||||||||||||||
|
|
|
|
|
|
|
|
|
|
|
|||||||||||||
| 818 | 10,000 | 6,542 | (500 | ) | 16,042 | |||||||||||||||||
|
|
|
|
|
|
|
|
|
|
|
|||||||||||||
| TOTAL CONTROL INVESTMENTS |
$ | 818 | $ | 10,000 | $ | 6,542 | $ | (500 | ) | $ | 16,042 | |||||||||||
|
|
|
|
|
|
|
|
|
|
|
|||||||||||||
| AFFILIATE INVESTMENTS |
||||||||||||||||||||||
| Acme Cryogenics, Inc.(G) |
Secured Second Lien Term Loan | $ | 111 | $ | 14,500 | $ | — | $ | (14,500 | ) | $ | — | ||||||||||
| Preferred Stock | 2,750 | 22,337 | — | (22,337 | ) | — | ||||||||||||||||
| Common Stock | — | 4,201 | — | (4,201 | ) | — | ||||||||||||||||
| Common Stock Warrants | — | 3,856 | — | (3,856 | ) | — | ||||||||||||||||
|
|
|
|
|
|
|
|
|
|
|
|||||||||||||
| 2,861 | 44,894 | — | (44,894 | ) | — | |||||||||||||||||
| Alloy Die Casting Corp. |
Secured First Lien Term Loan(F) | 1,260 | 11,390 | — | (1,618 | ) | 9,772 | |||||||||||||||
| Secured First Lien Term Loan | — | — | 910 | (178 | ) | 732 | ||||||||||||||||
| Secured First Lien Term Loan(F) | 17 | — | 175 | (35 | ) | 140 | ||||||||||||||||
| Preferred Stock | — | 612 | 840 | (1,452 | ) | — | ||||||||||||||||
| Common Stock | — | — | — | — | — | |||||||||||||||||
|
|
|
|
|
|
|
|
|
|
|
|||||||||||||
| 1,277 | 12,002 | 1,925 | (3,283 | ) | 10,644 | |||||||||||||||||
| Behrens Manufacturing, LLC(G) |
Secured First Lien Term Loan | 1,857 | 9,975 | — | (9,975 | ) | — | |||||||||||||||
| Preferred Stock | (505 | )(J) | 8,593 | — | (8,593 | ) | — | |||||||||||||||
|
|
|
|
|
|
|
|
|
|
|
|||||||||||||
| 1,352 | 18,568 | — | (18,568 | ) | — | |||||||||||||||||
| Brunswick Bowling Products, Inc. |
Secured First Lien Term Loan | 2,093 | 11,307 | — | — | 11,307 | ||||||||||||||||
| Preferred Stock | — | 5,267 | 6,062 | — | 11,329 | |||||||||||||||||
|
|
|
|
|
|
|
|
|
|
|
|||||||||||||
| 2,093 | 16,574 | 6,062 | — | 22,636 | ||||||||||||||||||
| B+T Group Acquisition, Inc. |
Secured First Lien Term Loan | 1,845 | 14,000 | — | — | 14,000 | ||||||||||||||||
| Preferred Stock | — | — | — | — | — | |||||||||||||||||
|
|
|
|
|
|
|
|
|
|
|
|||||||||||||
| 1,845 | 14,000 | — | — | 14,000 | ||||||||||||||||||
| Cambridge Sound Management, Inc. |
Secured Second Lien Term Loan | 2,065 | 15,000 | 1,000 | — | 16,000 | ||||||||||||||||
| Preferred Equity | — | 12,835 | — | (1,789 | ) | 11,046 | ||||||||||||||||
|
|
|
|
|
|
|
|
|
|
|
|||||||||||||
| 2,065 | 27,835 | 1,000 | (1,789 | ) | 27,046 | |||||||||||||||||
| Channel Technologies Group, LLC |
Preferred Stock | — | 989 | 109 | (1,098 | ) | — | |||||||||||||||
| Common Stock |
— | — | — | — | — | |||||||||||||||||
|
|
|
|
|
|
|
|
|
|
|
|||||||||||||
| — | 989 | 109 | (1,098 | ) | — | |||||||||||||||||
| Counsel Press, Inc.(I) |
Secured First Lien Line of Credit | 10 | — | — | — | — | ||||||||||||||||
| Secured First Lien Term Loan | 2,327 | 18,000 | — | (18,000 | ) | — | ||||||||||||||||
| Secured First Lien Term Loan | 781 | 5,500 | — | (5,500 | ) | — | ||||||||||||||||
| Preferred Equity | — | 5,399 | 1,596 | (6,995 | ) | — | ||||||||||||||||
|
|
|
|
|
|
|
|
|
|
|
|||||||||||||
| 3,118 | 28,899 | 1,596 | (30,495 | ) | — | |||||||||||||||||
| D.P.M.S., Inc. |
Secured First Lien Line of Credit | 97 | 4,000 | — | (4,000 | ) | — | |||||||||||||||
| Secured First Lien Term Loan | 61 | 2,575 | — | (2,575 | ) | — | ||||||||||||||||
| Secured First Lien Term Loan | 209 | 2,073 | 6,723 | (8,796 | ) | — | ||||||||||||||||
| Secured First Lien Term Loan | 36 | — | 1,150 | (1,150 | ) | — | ||||||||||||||||
| Secured First Lien Term Loan | 371 | — | 8,796 | (1,621 | ) | 7,175 | ||||||||||||||||
| Preferred Stock | — | — | 2,500 | (2,500 | ) | — | ||||||||||||||||
| Common Stock | — | — | 1 | (1 | ) | — | ||||||||||||||||
|
|
|
|
|
|
|
|
|
|
|
|||||||||||||
| 774 | 8,648 | 19,170 | (20,643 | ) | 7,175 | |||||||||||||||||
113
GLADSTONE INVESTMENT CORPORATION
INVESTMENTS IN AND ADVANCES TO AFFILIATES (Continued)
(AMOUNTS IN THOUSANDS)
| Name of Issuer(A) |
Title of Issue or |
Amount of |
Value as of 2016 |
Gross |
Gross |
Value as of |
||||||||||||||||
| Edge Adhesives Holdings, Inc. |
Secured First Lien Term Loan | $ | 1,179 | $ | 8,928 | $ | 279 | $ | — | $ | 9,207 | |||||||||||
| Secured First Lien Term Loan | 334 | 2,310 | 78 | — | 2,388 | |||||||||||||||||
| Preferred Stock | — | — | 1,271 | — | 1,271 | |||||||||||||||||
|
|
|
|
|
|
|
|
|
|
|
|||||||||||||
| 1,513 | 11,238 | 1,628 | — | 12,866 | ||||||||||||||||||
| GI Plastek, Inc. |
Secured First Lien Term Loan | 2,015 | 15,000 | — | — | 15,000 | ||||||||||||||||
| Preferred Stock | — | 5,672 | 82 | — | 5,754 | |||||||||||||||||
|
|
|
|
|
|
|
|
|
|
|
|||||||||||||
| 2,015 | 20,672 | 82 | — | 20,754 | ||||||||||||||||||
| Head Country Food Products, Inc. |
Secured First Lien Term Loan | 1,147 | 9,050 | — | — | 9,050 | ||||||||||||||||
| Preferred Stock | — | — | 5,752 | — | 5,752 | |||||||||||||||||
|
|
|
|
|
|
|
|
|
|
|
|||||||||||||
| 1,147 | 9,050 | 5,752 | — | 14,802 | ||||||||||||||||||
| JR Hobbs Co. – Atlanta, LLC(H) |
Secured First Lien Line of Credit | 33 | — | 2,950 | — | 2,950 | ||||||||||||||||
| Secured First Lien Term Loan | 326 | — | 21,000 | — | 21,000 | |||||||||||||||||
| Preferred Stock | — | — | 5,920 | — | 5,920 | |||||||||||||||||
|
|
|
|
|
|
|
|
|
|
|
|||||||||||||
| 359 | — | 29,870 | — | 29,870 | ||||||||||||||||||
| Logo Sportswear, Inc. |
Secured First Lien Term Loan |
1,400 | 9,200 | — | — | 9,200 | ||||||||||||||||
| Preferred Stock | 945 | 2,795 | 8,375 | — | 11,170 | |||||||||||||||||
|
|
|
|
|
|
|
|
|
|
|
|||||||||||||
| 2,345 | 11,995 | 8,375 | — | 20,370 | ||||||||||||||||||
| Meridian Rack & Pinion, Inc. |
Secured First Lien Term Loan | 1,322 | 8,791 | — | (145 | ) | 8,646 | |||||||||||||||
| Preferred Stock | — | 988 | 1,902 | — | 2,890 | |||||||||||||||||
|
|
|
|
|
|
|
|
|
|
|
|||||||||||||
| 1,322 | 9,779 | 1,902 | (145 | ) | 11,536 | |||||||||||||||||
| The Mountain Corporation(H) |
Secured First Lien Term Loan | 2,281 | — | 18,600 | — | 18,600 | ||||||||||||||||
| Preferred Stock | — | — | 6,899 | (6,746 | ) | 153 | ||||||||||||||||
| Common Stock | — | — | 1 | (1 | ) | — | ||||||||||||||||
|
|
|
|
|
|
|
|
|
|
|
|||||||||||||
| 2,281 | — | 25,500 | (6,747 | ) | 18,753 | |||||||||||||||||
| NDLI, Inc. |
Preferred Stock | — | — | — | — | — | ||||||||||||||||
| Common Stock | — | — | — | — | — | |||||||||||||||||
|
|
|
|
|
|
|
|
|
|
|
|||||||||||||
| — | — | — | — | — | ||||||||||||||||||
| Old World Christmas, Inc. |
Secured First Lien Term Loan | 2,119 | 15,770 | — | — | 15,770 | ||||||||||||||||
| Preferred Stock | — | 4,159 | 2,976 | — | 7,135 | |||||||||||||||||
|
|
|
|
|
|
|
|
|
|
|
|||||||||||||
| 2,119 | 19,929 | 2,976 | — | 22,905 | ||||||||||||||||||
| Precision Southeast, Inc. |
Secured Second Lien Term Loan | 1,365 | 9,618 | — | — | 9,618 | ||||||||||||||||
| Preferred Stock | — | 3,922 | — | (3,922 | ) | — | ||||||||||||||||
| Common Stock | — | — | — | — | — | |||||||||||||||||
|
|
|
|
|
|
|
|
|
|
|
|||||||||||||
| 1,365 | 13,540 | — | (3,922 | ) | 9,618 | |||||||||||||||||
| SOG Specialty Knives & Tools, LLC |
Secured First Lien Term Loan | 833 | 6,200 | — | — | 6,200 | ||||||||||||||||
| Secured First Lien Term Loan | 1,825 | 12,200 | — | — | 12,200 | |||||||||||||||||
| Preferred Stock | — | 7,747 | — | (7,036 | ) | 711 | ||||||||||||||||
|
|
|
|
|
|
|
|
|
|
|
|||||||||||||
| 2,658 | 26,147 | — | (7,036 | ) | 19,111 | |||||||||||||||||
| Tread Corporation(I) |
Secured First Lien Line of Credit(F) | — | 1,426 | 600 | (2,026 | ) | — | |||||||||||||||
| Preferred Stock | — | 538 | 3,229 | (3,767 | ) | — | ||||||||||||||||
| Common Stock | — | — | 753 | (753 | ) | — | ||||||||||||||||
|
|
|
|
|
|
|
|
|
|
|
|||||||||||||
| — | 1,964 | 4,582 | (6,546 | ) | — | |||||||||||||||||
|
|
|
|
|
|
|
|
|
|
|
|||||||||||||
| TOTAL AFFILIATE INVESTMENTS |
$ | 32,509 | $ | 296,723 | $ | 110,529 | $ | (145,166 | ) | $ | 262,086 | |||||||||||
|
|
|
|
|
|
|
|
|
|
|
|||||||||||||
114
| (A) | Certain of the listed securities are issued by affiliate(s) of the indicated portfolio company. |
| (B) | Common stock, warrants, options and, in some cases, preferred stock are generally non-income-producing and restricted. The principal amount of debt and the number of shares of common stock and preferred stock are shown in the accompanying Consolidated Schedule of Investments as of March 31, 2017. |
| (C) | Represents the total amount of interest or other investment income credited to income for the portion of the year an investment was a control investment or affiliate investment, as appropriate. |
| (D) | Gross additions include increases in investments resulting from new portfolio investments, paid-in-kind interest or dividends, the amortization of discounts and fees and the exchange of one or more existing securities for one or more new securities. Gross additions also include net increases in unrealized appreciation or decreases in unrealized depreciation. |
| (E) | Gross reductions include decreases in investments resulting from principal collections related to investment repayments or sales, the amortization of premiums and acquisition costs and the exchange of one or more existing securities for one or more new securities. Gross reductions also include net increases in unrealized depreciation or decreases in unrealized appreciation. |
| (F) | Debt security is on non-accrual status and, therefore, is considered non-income producing as of March 31, 2017. |
| (G) | Investment was exited during the year ended March 31, 2017. |
| (H) | New investment during the year ended March 31, 2017. |
| (I) | As a result of changes in the investment structure, Counsel Press, Inc. and Tread Corporation were transferred from Affiliate to Non-Control/Non-Affiliate during the year ended March 31, 2017. |
| (J) | During the year ended March 31, 2017, we re-characterized $0.5 million of dividend income from our investment in Behrens Manufacturing, LLC, which was originally recorded during our fiscal year ended March 31, 2016, as a return of capital. |
| ** | Information related to the amount of equity in the net profit and loss for the period for the investments listed has not been included in this schedule. This information is not considered to be meaningful due to the complex capital structures of the portfolio companies, with different classes of equity securities outstanding with different preferences in liquidation. These investments are not consolidated, nor are they accounted for under the equity method of accounting. |
115