Incentive Fee
The incentive fee payable to the Adviser under our Advisory Agreement consists of two parts: an income-based incentive fee and a capital gains-based incentive fee.
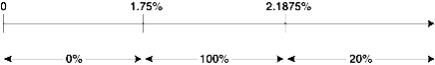
The income-based incentive fee rewards the Adviser if our quarterly net investment income (before giving effect to any incentive fee) exceeds 1.75% of our net assets, which we define as total assets less indebtedness and before taking into account any incentive fees payable or contractually due but not payable during the period, at the end of the immediately preceding calendar quarter, adjusted appropriately for any share issuances or repurchases during the period (the “Hurdle Rate”). The income-based incentive fee with respect to our pre-incentive fee net investment income is payable quarterly to the Adviser and is computed as follows:
| • | No incentive fee in any calendar quarter in which our pre-incentive fee net investment income does not exceed the Hurdle Rate; |
| • | 100.0% of our pre-incentive fee net investment income with respect to that portion of such pre-incentive fee net investment income, if any, that exceeds the Hurdle Rate but is less than 2.1875% of our net assets, adjusted appropriately for any share issuances or repurchases during the period, in any calendar quarter; and |
| • | 20.0% of the amount of our pre-incentive fee net investment income, if any, that exceeds 2.1875% of our net assets, adjusted appropriately for any share issuances or repurchases during the period, in any calendar quarter. |
Quarterly Incentive Fee Based on Net Investment Income
Pre-incentive fee net investment income
(expressed as a percentage of the value of net assets)
Percentage of pre-incentive fee net investment income
allocated to income-related portion of incentive fee
The second part of the incentive fee is a capital gains-based incentive fee that is determined and payable in arrears as of the end of each fiscal year (or upon termination of the Advisory Agreement, as of the termination date), and equals 20.0% of our realized capital gains, less any realized capital losses and unrealized depreciation, calculated as of the end of the preceding calendar year. The capital gains-based incentive fee payable to the Adviser is calculated based on (i) cumulative aggregate realized capital gains since our inception, less (ii) cumulative aggregate realized capital losses since our inception, less (iii) the entire portfolio’s aggregate unrealized capital depreciation, if any, as of the date of the calculation. If this number is positive at the applicable calculation date, then the capital gains-based incentive fee for such year equals 20.0% of such amount, less the aggregate amount of any capital gains-based incentive fees paid in respect of our portfolio in all prior years. For calculation purposes, cumulative aggregate realized capital gains, if any, equals the sum of the excess between the net sales price of each investment, when sold, and the original cost of such investment since our inception. Cumulative aggregate realized capital losses equals the sum of the deficit between the net sales price of each investment, when sold, and the original cost of such investment since our inception. The entire portfolio’s aggregate unrealized capital depreciation, if any, equals the sum of the deficit between the fair value of each investment security as of the applicable calculation date and the original cost of such investment security. We have not incurred capital gains-based incentive fees from inception through March 31, 2019, as aggregate unrealized capital depreciation has exceeded cumulative realized capital gains net of cumulative realized capital losses.
In accordance with GAAP, accrual of the capital gains-based incentive fee is determined as if our investments had been liquidated at their fair values as of the end of the reporting period. Therefore, GAAP requires that the capital gains-based incentive fee accrual consider the aggregate unrealized capital appreciation in the calculation, as a capital gains-based incentive fee would be payable if such unrealized capital appreciation were realized. There can be no assurance that any such unrealized capital appreciation will be realized in the future. Accordingly, a GAAP accrual is calculated at the end of the reporting period based on (i) cumulative aggregate realized capital gains since our inception, plus (ii) the entire portfolio’s aggregate unrealized capital appreciation, if any, less (iii) cumulative aggregate realized capital losses since our inception, less (iv) the entire portfolio’s aggregate unrealized capital depreciation, if any. If such amount is positive at the end of a reporting period, a capital gains-based incentive fee equal to 20.0% of such amount, less the aggregate amount of actual capital gains-based incentive fees paid in all prior years, is recorded, regardless of whether such amount is contractually due under the terms of the Advisory Agreement.
11